What Is An Age Structure Diagram
Muz Play
Mar 30, 2025 · 7 min read
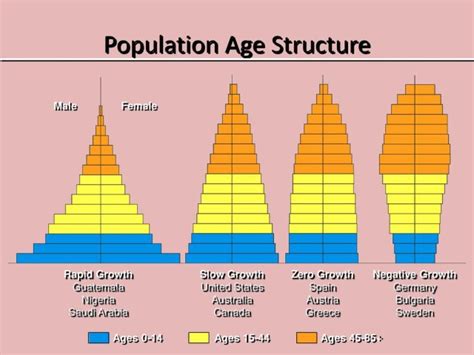
Table of Contents
What is an Age Structure Diagram? A Comprehensive Guide
An age structure diagram, also known as a population pyramid, is a powerful visual tool used to represent the age and sex composition of a population. It provides a snapshot of a population's demographic profile, offering valuable insights into its past, present, and future trends. Understanding age structure diagrams is crucial for various fields, including demography, sociology, economics, and public health, as they inform crucial decisions regarding resource allocation, infrastructure development, and policy planning. This comprehensive guide will explore the intricacies of age structure diagrams, covering their construction, interpretation, and significance.
Understanding the Structure of an Age Structure Diagram
The diagram itself is a graphical representation, typically a bar chart, with the horizontal axis representing the population size (often expressed as a percentage or number) and the vertical axis representing age groups (usually in five-year intervals). Each bar is further divided into two sections: one representing males and the other representing females. This allows for a clear comparison of the age and sex distribution within the population.
Key Components of an Age Structure Diagram:
-
Age Groups: The vertical axis is divided into age cohorts, typically in 5-year intervals (e.g., 0-4, 5-9, 10-14, etc.). However, the interval can vary depending on the data availability and the specific focus of the analysis. The highest age group is usually open-ended (e.g., 85+).
-
Population Size: The horizontal axis shows the number or percentage of individuals within each age group. The scale is chosen to ensure clear visualization and comparison between age groups.
-
Sex Distribution: Each age group bar is typically divided into two halves, one representing the male population and the other representing the female population. Different colors or patterns are commonly used to distinguish between the sexes.
-
Shape of the Pyramid: The overall shape of the diagram provides valuable information about the population's growth rate and future trends. We'll explore the different shapes and their implications in the following sections.
Interpreting Age Structure Diagrams: Shapes and Their Implications
The shape of an age structure diagram is a key indicator of a population's current state and its projected future. Three primary shapes are commonly observed:
1. Expansive Pyramid (Rapid Growth):
This pyramid is characterized by a wide base, representing a large proportion of young individuals. The bars gradually narrow as age increases, indicating declining survival rates with age. This shape is typical of developing countries with high birth rates and relatively high death rates. The large number of young people entering reproductive age suggests that the population will continue to grow rapidly in the coming years. This presents challenges related to resource allocation, infrastructure development, and employment opportunities.
Key Characteristics of an Expansive Pyramid:
- Wide base: Indicates high birth rates.
- Narrowing top: Suggests lower life expectancy.
- Rapid population growth: Implies future strain on resources.
2. Constrictive Pyramid (Slow Growth or Decline):
This pyramid features a narrow base and a relatively larger proportion of older individuals. The birth rate is low, and the population is aging. This shape is commonly observed in developed countries with access to advanced healthcare and family planning. While economic challenges related to aging populations exist, the slower growth rate can ease pressure on resources in the short term. However, it brings forth significant long-term concerns regarding pension systems, healthcare costs, and workforce shortages.
Key Characteristics of a Constrictive Pyramid:
- Narrow base: Suggests low birth rates.
- Wider middle and top: Indicates a larger proportion of older individuals.
- Slow or negative population growth: Implies potential workforce shortages and aging infrastructure.
3. Stationary Pyramid (Stable Growth):
This pyramid displays a relatively uniform distribution of the population across age groups. The birth rate and death rate are roughly balanced, resulting in a slow or stable population growth. The overall shape is more rectangular than the expansive or constrictive pyramids. This pattern indicates a population that is neither rapidly growing nor shrinking, potentially suggesting a demographic equilibrium.
Key Characteristics of a Stationary Pyramid:
- Relatively uniform distribution: Indicates balanced birth and death rates.
- Slow or stable population growth: Implies a more manageable demographic situation.
Beyond the Basic Shapes: Understanding Nuances and Variations
While the three basic shapes provide a general understanding of population dynamics, it is crucial to recognize that real-world population pyramids often exhibit variations and complexities. Factors such as wars, epidemics, economic crises, and government policies can significantly influence the shape of the pyramid. Furthermore, comparing pyramids from different countries or regions allows for interesting insights into international demographic trends.
Factors influencing deviations from basic shapes:
-
War and Conflict: Major conflicts can drastically reduce the number of individuals in specific age cohorts, leading to visible indentations or distortions in the pyramid.
-
Epidemics and Pandemics: Outbreaks of infectious diseases can impact mortality rates across various age groups, creating irregularities in the pyramid's shape.
-
Economic Fluctuations: Economic recessions or booms can influence birth rates and migration patterns, affecting the distribution of the population across age groups.
-
Government Policies: Family planning policies, immigration laws, and retirement policies can significantly shape the demographic composition of a population.
-
Migration: Significant inward or outward migration can lead to distortions in age structure, particularly affecting certain age groups. For example, a country experiencing significant immigration might have a larger proportion of young adults compared to its native-born population.
Applications of Age Structure Diagrams: Practical Uses Across Disciplines
Age structure diagrams are not merely theoretical tools; they have significant practical applications in various fields:
1. Public Health:
Analyzing age structure diagrams enables public health officials to anticipate future health needs. For instance, a population with a large proportion of elderly individuals will likely experience increased demand for geriatric care, prompting strategic planning for healthcare resources.
2. Education:
Understanding the age distribution helps educational institutions plan for future enrollment and resource allocation. A large cohort of children entering the school system requires increased investment in schools and teachers.
3. Economic Planning:
Economists utilize these diagrams to forecast workforce participation rates and plan for future economic growth. A shrinking workforce requires innovative strategies to maintain economic productivity.
4. Social Welfare:
Social welfare agencies rely on age structure diagrams to understand the demands for social services, including pensions, healthcare, and social security benefits. Anticipating the needs of an aging population is crucial for effective resource management.
5. Urban Planning:
Urban planners use this data to design cities that accommodate the needs of diverse age groups, from creating age-friendly infrastructure to providing adequate housing and recreational facilities.
Limitations of Age Structure Diagrams: Interpreting with Caution
While incredibly useful, age structure diagrams have limitations. They provide a static representation of the population at a specific point in time. They don't account for dynamic factors such as migration, mortality fluctuations, or changes in fertility rates. It’s crucial to remember these diagrams offer snapshots, not predictions. While they suggest likely trends, other contextual factors should be considered for accurate forecasting.
Furthermore, the interpretation of age structure diagrams requires expertise and careful consideration of the context. Oversimplifying the interpretation can lead to inaccurate conclusions. It’s essential to combine these diagrams with other demographic data and indicators for a holistic understanding of population dynamics.
Conclusion: A Powerful Tool for Understanding Population Dynamics
Age structure diagrams are invaluable tools for visualizing and analyzing the age and sex composition of populations. Their ability to illustrate population growth patterns, highlight potential demographic challenges, and inform policy decisions makes them an indispensable resource for researchers, policymakers, and anyone interested in understanding population dynamics. While acknowledging their limitations, these diagrams offer a powerful starting point for anticipating future needs and creating effective strategies for sustainable development. By combining the information gleaned from these diagrams with other demographic data and contextual factors, a more nuanced and accurate picture of a population's present and future can be formed. This, in turn, facilitates informed decision-making across various sectors, ensuring the effective allocation of resources and fostering sustainable societal development.
Latest Posts
Latest Posts
-
Integration By Parts How To Choose U And Dv
Apr 01, 2025
-
Protein Synthesis Takes Place In The
Apr 01, 2025
-
Microscopic Anatomy Of A Muscle Fiber
Apr 01, 2025
-
What Is The General Equation For Cellular Respiration
Apr 01, 2025
-
Are Influence Lines In The Fe Exam
Apr 01, 2025
Related Post
Thank you for visiting our website which covers about What Is An Age Structure Diagram . We hope the information provided has been useful to you. Feel free to contact us if you have any questions or need further assistance. See you next time and don't miss to bookmark.
