What Is An Example Of A Statistical Question
Muz Play
Mar 27, 2025 · 6 min read
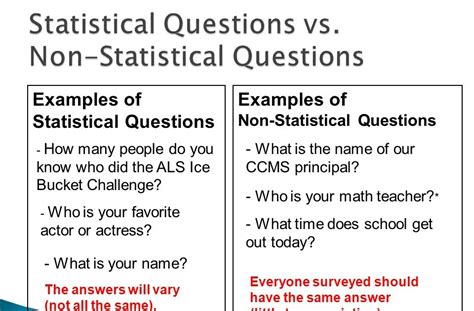
Table of Contents
What is an Example of a Statistical Question? Unlocking the Power of Data Through Inquiry
Understanding what constitutes a statistical question is crucial for anyone working with data, from students analyzing classroom results to seasoned researchers conducting large-scale studies. It's the foundation upon which insightful analysis is built. This comprehensive guide will delve into the definition, provide numerous examples across various contexts, and highlight the key differences between statistical and non-statistical questions. We'll also explore how to formulate effective statistical questions to drive meaningful conclusions.
Defining a Statistical Question
A statistical question is one that can be answered by collecting data and that anticipates variability in the data. This variability is key; it's what distinguishes a statistical question from a simple factual question. A statistical question doesn't seek a single definitive answer but rather explores the distribution and patterns within a dataset. It aims to understand the range, central tendency, and spread of the data, allowing for inferences and generalizations about a population.
Key characteristics of a statistical question:
- Requires data collection: The answer can't be found without gathering data from multiple sources or individuals.
- Anticipates variability: The answers to the question will vary, and this variation is meaningful and worth exploring.
- Focuses on a population or sample: The question aims to understand something about a larger group (population) based on a smaller subset (sample).
- Leads to inferences and generalizations: The analysis of the collected data will allow conclusions to be drawn about the larger population.
Examples of Statistical Questions Across Different Contexts
Let's explore diverse examples to solidify the understanding of statistical questions:
Education:
- What are the average scores on a standardized test for students in a particular school district? This question anticipates variability in test scores across students. Analyzing the data might reveal patterns related to socioeconomic factors, teaching methods, or other variables.
- How does the amount of time students spend studying affect their final exam grades? This investigates the relationship between two variables (study time and exam grades), expecting a range of study times and corresponding grades.
- What is the distribution of student ages in a specific college course? This focuses on the variability of student ages within the course. The answer would likely show a range of ages, not a single age.
- What percentage of students in a school participate in extracurricular activities? This anticipates variability in student participation levels and will likely provide a range of percentages for different activities.
Healthcare:
- What is the average blood pressure of patients with a specific condition? This anticipates variability in blood pressure readings across patients with the condition. The data analysis will reveal a range of values and might reveal potential correlations with other factors.
- How effective is a new drug in reducing symptoms of a particular illness? This requires data collection on symptom severity before and after treatment, anticipating variability in patient response to the drug.
- What is the average length of hospital stay for patients undergoing a specific surgery? This anticipates variability in recovery times and will provide a range of lengths of stay rather than a single value.
- How does smoking affect the risk of developing lung cancer? This explores the relationship between two variables, anticipating variability in both smoking habits and occurrence of lung cancer.
Business and Marketing:
- What is the average customer satisfaction rating for a particular product? This anticipates variability in customer opinions and aims to understand the distribution of ratings.
- How does advertising spending impact sales revenue? This explores the relationship between two variables, expecting variations in both spending and revenue.
- What is the average order value for online customers? This anticipates variability in the amounts spent per order.
- What is the distribution of customer ages who purchase a specific product? This will identify the range of ages among the product’s buyers, helping target marketing efforts.
Environment:
- What is the average rainfall in a particular region over the past decade? This anticipates variability in rainfall amounts over the years. The data can highlight trends and potential climate changes.
- What is the average temperature of a specific lake throughout the year? This anticipates variations in temperature across the seasons.
- How does the level of pollution affect the health of a specific ecosystem? This involves correlational analysis, anticipating variability in both pollution levels and ecosystem health indicators.
- What is the distribution of tree species in a particular forest? This anticipates variability in the types and numbers of tree species present.
Social Sciences:
- What are the average household incomes in a particular city? This anticipates variability in income levels across different households.
- What is the distribution of political affiliations among voters in a specific region? This will reveal the range of political preferences and their prevalence.
- How does social media usage affect levels of self-esteem among adolescents? This examines the relationship between two variables, anticipating variations in both social media usage and self-esteem.
- What is the average number of hours people spend watching television per week? This question anticipates that the number of hours will vary among individuals.
Examples of Non-Statistical Questions
To fully grasp the concept of a statistical question, it's helpful to contrast it with non-statistical questions. Non-statistical questions have single, definitive answers that don't involve variability or data collection from multiple sources.
- What is the capital of France? (Answer: Paris)
- How many sides does a square have? (Answer: 4)
- What is the name of the current president? (Answer: [Current President's Name])
- What color is the sky on a clear day? (Answer: Blue)
These questions require simple recall or factual knowledge, not data analysis to reveal variability.
Formulating Effective Statistical Questions
Creating effective statistical questions is crucial for conducting meaningful research. Here are some tips:
- Clearly define the population: Specify the group you're studying (e.g., students in a specific school, patients with a particular condition, customers of a particular company).
- Identify the variable(s) of interest: What characteristics are you measuring or investigating (e.g., test scores, blood pressure, customer satisfaction)?
- Anticipate variability: Consider how the variable(s) might vary within the population.
- Ensure the question is measurable: The data needed to answer the question should be readily collectable.
- Keep it concise and focused: Avoid overly broad or ambiguous questions.
Conclusion: The Power of Statistical Inquiry
Understanding the nuances of statistical questions is fundamental to effective data analysis. By learning to formulate clear, well-defined statistical questions, we unlock the power of data to uncover patterns, identify trends, and draw meaningful conclusions about the world around us. This ability is essential across numerous fields, from education and healthcare to business and environmental science, enabling informed decision-making and a deeper understanding of complex phenomena. Remember that the key lies in anticipating variability and collecting data to explore the distribution of answers, allowing for insightful generalizations and inferences.
Latest Posts
Latest Posts
-
What Is The Number Of Protons In Beryllium
Mar 30, 2025
-
Female Reproductive System Diagram Side View
Mar 30, 2025
-
How Many Valence Electrons In B
Mar 30, 2025
-
What Is The Magnification Of Microscope
Mar 30, 2025
-
Testing For Cations And Anions Report Sheet
Mar 30, 2025
Related Post
Thank you for visiting our website which covers about What Is An Example Of A Statistical Question . We hope the information provided has been useful to you. Feel free to contact us if you have any questions or need further assistance. See you next time and don't miss to bookmark.
