What Is The Symbol For Population Variance
Muz Play
Mar 30, 2025 · 5 min read
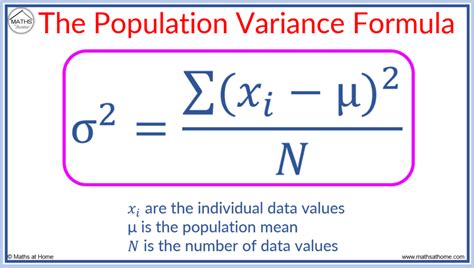
Table of Contents
What is the Symbol for Population Variance? Understanding Variance in Statistics
The symbol for population variance is σ² (sigma squared). Understanding population variance is crucial in statistics, as it provides a measure of the spread or dispersion of data points within an entire population. This article will delve deep into the concept of population variance, explaining its meaning, calculation, significance, and its relationship to other statistical measures. We'll also explore the differences between population variance and sample variance.
What is Population Variance?
Population variance quantifies the average squared deviation of each data point from the population mean. In simpler terms, it tells us how far, on average, the individual data points are spread out from the center of the data (the mean). A high population variance indicates a large spread of data, while a low population variance signifies that data points are clustered tightly around the mean.
Think of it this way: Imagine two datasets representing the heights of students in two different classes. One class has a small variance, meaning the students' heights are relatively similar. The other class has a large variance, indicating a greater range of heights among the students.
Calculating Population Variance: A Step-by-Step Guide
The formula for calculating population variance is:
σ² = Σ(xi - μ)² / N
Where:
- σ² represents the population variance.
- Σ denotes the sum of.
- xi represents each individual data point in the population.
- μ represents the population mean.
- N represents the total number of data points in the population.
Let's break down the calculation process:
-
Calculate the population mean (μ): Sum all the data points and divide by the total number of data points (N).
-
Calculate the deviation of each data point from the mean (xi - μ): Subtract the mean (μ) from each individual data point (xi).
-
Square each deviation [(xi - μ)²]: Squaring the deviations ensures that negative deviations don't cancel out positive deviations, giving a true representation of the spread.
-
Sum the squared deviations [Σ(xi - μ)²]: Add up all the squared deviations.
-
Divide by the population size (N): Divide the sum of squared deviations by the total number of data points to find the average squared deviation – the population variance.
Example Calculation:
Let's say we have a population of five data points: 2, 4, 6, 8, 10.
-
Calculate the mean (μ): (2 + 4 + 6 + 8 + 10) / 5 = 6
-
Calculate the deviations:
- (2 - 6) = -4
- (4 - 6) = -2
- (6 - 6) = 0
- (8 - 6) = 2
- (10 - 6) = 4
-
Square the deviations:
- (-4)² = 16
- (-2)² = 4
- (0)² = 0
- (2)² = 4
- (4)² = 16
-
Sum the squared deviations: 16 + 4 + 0 + 4 + 16 = 40
-
Divide by N: 40 / 5 = 8
Therefore, the population variance (σ²) for this dataset is 8.
Population Variance vs. Sample Variance
It's crucial to differentiate between population variance (σ²) and sample variance (s²). While both measure the spread of data, they use different formulas and represent different things.
-
Population Variance (σ²): Calculates the variance of the entire population. It's used when you have data for every member of the population. The formula, as discussed above, divides by N (population size).
-
Sample Variance (s²): Calculates the variance of a sample drawn from a population. It's used when you have data for only a subset of the population. The formula divides by n-1 (sample size minus 1), where 'n' is the number of data points in the sample. This adjustment (dividing by n-1 instead of n) is called Bessel's correction, and it provides an unbiased estimate of the population variance. The symbol for sample variance is s².
The use of n-1 in the sample variance calculation is crucial because it corrects for the bias introduced by using a sample instead of the entire population. A sample typically underestimates the true population variance, and Bessel's correction helps mitigate this bias.
Significance and Applications of Population Variance
Understanding population variance has wide-ranging applications across numerous fields:
-
Finance: Analyzing the volatility of stock prices or investment returns. High variance indicates higher risk.
-
Quality Control: Monitoring the consistency of manufacturing processes. Low variance indicates high quality and consistent output.
-
Healthcare: Studying the variability in patient responses to treatment. Understanding variance helps assess treatment efficacy and identify potential outliers.
-
Environmental Science: Analyzing the dispersion of pollutants or the variability in environmental parameters.
-
Social Sciences: Understanding the distribution of income, education levels, or other social indicators within a population.
-
Engineering: Assessing the reliability and precision of measurements or systems.
Relationship to Standard Deviation
Population variance is closely related to population standard deviation (σ). Standard deviation is simply the square root of the variance:
σ = √σ²
Standard deviation is often preferred over variance because it's expressed in the same units as the original data, making it easier to interpret and compare across different datasets. While variance provides a measure of the squared dispersion, standard deviation gives a measure of the average distance of data points from the mean in the original units.
Interpreting Population Variance: High vs. Low Variance
-
High Variance: Indicates that the data points are widely spread out from the mean. This suggests greater variability and potentially higher uncertainty.
-
Low Variance: Indicates that the data points are clustered closely around the mean. This suggests less variability and higher consistency.
Conclusion: The Importance of Understanding Population Variance
The symbol σ², representing population variance, is a fundamental concept in statistics. Understanding its calculation, significance, and relationship to other statistical measures like standard deviation is essential for analyzing data and drawing meaningful conclusions. Whether in finance, healthcare, or environmental science, grasping the concept of population variance allows for a more thorough understanding of data variability and provides valuable insights for informed decision-making. Remember the key difference between population and sample variance, and choose the appropriate formula based on whether you're analyzing the entire population or a sample. Proper application of these concepts is key to accurate statistical analysis.
Latest Posts
Latest Posts
-
How Many Times Smaller Is An Electron Than A Proton
Apr 01, 2025
-
Which Homeostatic Process Moves Particles Against A Concentration Gradient
Apr 01, 2025
-
What Is The Intersection Of A Line And A Plane
Apr 01, 2025
-
Balance Sheet Of A Sole Proprietorship
Apr 01, 2025
-
What Magnification Is The Ocular Lens
Apr 01, 2025
Related Post
Thank you for visiting our website which covers about What Is The Symbol For Population Variance . We hope the information provided has been useful to you. Feel free to contact us if you have any questions or need further assistance. See you next time and don't miss to bookmark.
