What Is The Z Score For 98 Confidence Interval
Muz Play
Apr 01, 2025 · 5 min read
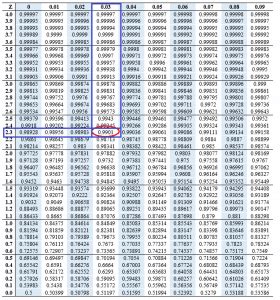
Table of Contents
What is the Z-score for a 98% Confidence Interval?
Determining the appropriate Z-score for a 98% confidence interval is crucial for accurately calculating confidence intervals in statistical analysis. This seemingly simple question involves understanding the fundamentals of confidence intervals, Z-scores, and the relationship between them. This article will delve into the specifics, providing a clear explanation and practical applications.
Understanding Confidence Intervals
Before diving into the Z-score, let's solidify our understanding of confidence intervals. A confidence interval provides a range of values within which a population parameter (like the mean or proportion) is likely to fall with a certain level of confidence. This level of confidence is expressed as a percentage, commonly 90%, 95%, or 98%.
A 98% confidence interval, for instance, means that if we were to repeatedly sample from a population and construct numerous 98% confidence intervals, approximately 98% of those intervals would contain the true population parameter. It's crucial to remember that this doesn't guarantee the true parameter lies within this specific interval; it simply indicates the probability of containment over many repetitions.
The Role of Z-scores in Confidence Intervals
Z-scores, also known as standard scores, represent the number of standard deviations a particular data point is away from the mean of a normally distributed dataset. Their use in confidence intervals stems from the fact that the sampling distribution of the mean (the distribution of sample means from a population) approximates a normal distribution, especially for larger sample sizes (thanks to the Central Limit Theorem).
The Z-score for a confidence interval defines the boundaries of the interval. It dictates how far from the sample mean we need to extend to encompass the desired level of confidence. A larger confidence level necessitates a wider interval, and consequently, a larger Z-score.
Calculating the Z-score for a 98% Confidence Interval
The calculation isn't directly about finding a single value but rather finding the Z-score that corresponds to the area under the standard normal distribution curve representing the desired confidence level. Since a 98% confidence interval leaves 2% of the area in the tails (1% in each tail), we need to find the Z-score that corresponds to the area of 0.99 (0.98 + 0.01) to encompass 99% of the area under the curve.
This requires consulting a Z-table (also known as a standard normal table) or using statistical software.
Using a Z-table:
Locate the value closest to 0.9900 in the body of the Z-table. The corresponding Z-score will be your critical value. You'll find that the Z-score is approximately 2.33. This means that for a 98% confidence interval, we extend 2.33 standard deviations above and below the sample mean.
Using statistical software:
Most statistical software packages (like R, SPSS, Python with SciPy) have functions to directly calculate Z-scores for given confidence levels. For example, in R, you could use the qnorm() function:
qnorm(0.99)
This will output a value very close to 2.33.
Therefore, the Z-score for a 98% confidence interval is approximately 2.33. Remember to use the positive value (+2.33) when calculating the upper bound and the negative value (-2.33) when calculating the lower bound of your confidence interval.
Formula and Application
The general formula for calculating a confidence interval for the population mean (µ) is:
Confidence Interval = Sample Mean (x̄) ± Z-score * (Standard Error)
Where:
- x̄ is the sample mean.
- Z-score is the critical Z-value corresponding to the desired confidence level (in this case, 2.33).
- Standard Error is the standard deviation of the sample divided by the square root of the sample size (σ/√n, where σ is the population standard deviation and n is the sample size). If the population standard deviation is unknown, the sample standard deviation (s) is used as an estimate.
Let's illustrate with an example:
Suppose we have a sample of 100 students, and their average height is 170 cm with a sample standard deviation of 10 cm. To calculate the 98% confidence interval for the average height of all students:
-
Standard Error: 10 cm / √100 = 1 cm
-
Confidence Interval: 170 cm ± 2.33 * 1 cm = 170 cm ± 2.33 cm
-
Result: The 98% confidence interval for the average student height is approximately (167.67 cm, 172.33 cm).
Important Considerations
-
Sample Size: The accuracy of the confidence interval increases with larger sample sizes. The larger the sample, the closer the sampling distribution of the mean will be to a normal distribution, making the Z-score approximation more reliable.
-
Population Distribution: The assumption of a normally distributed population (or a large sample size allowing for the Central Limit Theorem) is vital for the validity of this Z-score approach. For small samples from non-normal populations, t-distributions should be used instead of Z-distributions.
-
Standard Deviation: Accurate estimation of the population standard deviation (or using a reliable sample standard deviation) is critical. If the standard deviation is significantly underestimated or overestimated, the confidence interval will be narrower or wider than it should be, respectively.
Beyond the Mean: Confidence Intervals for Proportions
While the example above focused on the mean, the Z-score approach can also be used to calculate confidence intervals for population proportions. The formula differs slightly, but the principle of using the Z-score to define the interval's width remains the same. The Z-score of 2.33 for a 98% confidence interval still applies. The formula for the confidence interval of a proportion involves the sample proportion, the sample size, and a slightly different calculation for the standard error.
Conclusion: Mastering the 98% Confidence Interval
The Z-score of 2.33 is fundamental when constructing a 98% confidence interval. This article highlighted its importance, the process of obtaining it, and how it is applied in practical scenarios. Remember to always consider the assumptions underlying the use of Z-scores and adapt your approach when necessary (e.g., using t-distributions for small samples). Accurate calculation of confidence intervals is a cornerstone of statistical inference, enabling researchers to draw meaningful conclusions about populations based on sample data. Understanding the Z-score and its implications is a crucial step in mastering statistical analysis and data interpretation. Remember to check your results against statistical software for verification. This will aid in reinforcing your understanding and detecting any potential computational errors. Practice using the formula with varied datasets and sample sizes to improve your proficiency. This hands-on experience is crucial for cementing your understanding and developing confidence in your calculations.
Latest Posts
Latest Posts
-
How To Read A Solubility Curve
Apr 02, 2025
-
Difference Between Fractional And Simple Distillation
Apr 02, 2025
-
What Are The Components Of A Language
Apr 02, 2025
-
How To Orthogonally Diagonalize A Matrix
Apr 02, 2025
-
State Of Matter That Has Definite Shape And Volume
Apr 02, 2025
Related Post
Thank you for visiting our website which covers about What Is The Z Score For 98 Confidence Interval . We hope the information provided has been useful to you. Feel free to contact us if you have any questions or need further assistance. See you next time and don't miss to bookmark.
