Formula For Mann Whitney U Test
Muz Play
Mar 24, 2025 · 7 min read
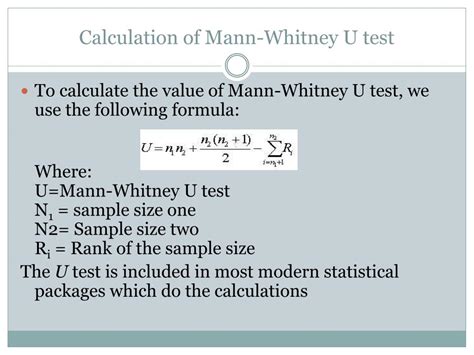
Table of Contents
The Mann-Whitney U Test: Formula, Application, and Interpretation
The Mann-Whitney U test, also known as the Wilcoxon rank-sum test, is a non-parametric statistical test used to compare two independent groups. Unlike parametric tests like the t-test, which assume normality of data, the Mann-Whitney U test makes no such assumptions. This makes it a robust and versatile tool for analyzing data where normality cannot be guaranteed. This comprehensive guide delves into the formula, application, and interpretation of the Mann-Whitney U test.
Understanding the Mann-Whitney U Test
The core purpose of the Mann-Whitney U test is to determine whether there's a statistically significant difference in the ranks of data between two independent groups. It doesn't directly compare the raw data values but instead focuses on their relative positions within the combined dataset. This makes it ideal for ordinal data (data that can be ranked) and for situations where the data is not normally distributed or has outliers that could skew results in parametric tests.
Key Assumptions:
- Independent samples: The two groups being compared should be independent of each other. Observations in one group shouldn't influence observations in the other.
- Ordinal data or continuous data that is not normally distributed: The data can be either ordinal (ranked) or continuous, as long as the underlying distribution isn't normal.
- At least 5 observations in each group: While there's no strict minimum sample size, having at least 5 observations in each group is generally recommended for reliable results.
The Formula for the Mann-Whitney U Test
The calculation of the Mann-Whitney U statistic can be done in two ways, both leading to the same result:
Method 1: Direct Calculation
The formula for calculating U is:
U₁ = n₁n₂ + n₁(n₁ + 1)/2 - R₁
Where:
- n₁: The number of observations in group 1.
- n₂: The number of observations in group 2.
- R₁: The sum of the ranks for group 1 (after ranking all observations from both groups).
And similarly for U₂:
U₂ = n₁n₂ + n₂(n₂ + 1)/2 - R₂
Where:
- R₂: The sum of the ranks for group 2.
The smaller value of U₁ and U₂ is the U statistic used for further analysis. Note that U₁ + U₂ = n₁n₂.
Method 2: Using the number of inversions
This method focuses on counting the number of times a value in group 1 is larger than a value in group 2.
For each observation in group 1, count the number of observations in group 2 that are smaller. Sum these counts to get U₁. Similarly, count the number of times an observation in group 2 is larger than one in group 1 to get U₂. This method, while conceptually simpler, can become cumbersome with larger datasets.
Step-by-Step Calculation Example
Let's illustrate the calculation with an example. Suppose we're comparing the performance scores of two groups (A and B) on a task:
Group A: 12, 15, 18, 20, 22 Group B: 10, 13, 16, 19
Step 1: Combine and Rank the Data
Combine the data from both groups and rank them from smallest to largest, assigning ranks accordingly:
| Value | Group | Rank |
|---|---|---|
| 10 | B | 1 |
| 12 | A | 2 |
| 13 | B | 3 |
| 15 | A | 4 |
| 16 | B | 5 |
| 18 | A | 6 |
| 19 | B | 7 |
| 20 | A | 8 |
| 22 | A | 9 |
Step 2: Calculate the Sum of Ranks for Each Group
- R₁ (Sum of ranks for Group A): 2 + 4 + 6 + 8 + 9 = 29
- R₂ (Sum of ranks for Group B): 1 + 3 + 5 + 7 = 16
Step 3: Apply the Formula
- n₁ (number of observations in Group A): 5
- n₂ (number of observations in Group B): 4
Using the formula for U₁:
U₁ = (5 * 4) + (5 * (5 + 1) / 2) - 29 = 20 + 15 - 29 = 6
Using the formula for U₂:
U₂ = (5 * 4) + (4 * (4 + 1) / 2) - 16 = 20 + 10 - 16 = 14
The smaller value of U is 6. Therefore, U = 6.
Interpreting the Results
The calculated U value itself doesn't directly indicate statistical significance. We need to compare it to the critical value from the Mann-Whitney U distribution table. This table provides critical values for different sample sizes (n₁ and n₂) and significance levels (usually α = 0.05).
Determining Statistical Significance:
-
Look up the critical value: Find the critical value in the Mann-Whitney U table corresponding to your sample sizes (n₁ and n₂) and chosen significance level (alpha).
-
Compare U to the critical value:
- If your calculated U value is less than or equal to the critical value, you reject the null hypothesis. This means there's a statistically significant difference between the two groups.
- If your calculated U value is greater than the critical value, you fail to reject the null hypothesis. This means there's not enough evidence to conclude a statistically significant difference.
The Null Hypothesis: The null hypothesis for the Mann-Whitney U test is that there is no difference in the distribution of ranks between the two groups. Rejecting the null hypothesis suggests that the difference in ranks is unlikely to have occurred by chance alone.
Effect Size: While statistical significance is important, it's also crucial to consider the effect size. This indicates the magnitude of the difference between the groups. Common effect size measures for the Mann-Whitney U test include:
- r (effect size correlation): This indicates the strength of the association between group membership and the rank. Values closer to +1 or -1 indicate a stronger effect.
- Cliff's delta: This measure is less sensitive to sample size differences than r.
Advantages and Disadvantages of the Mann-Whitney U Test
Advantages:
- Non-parametric: Doesn't assume normality, making it robust for various data types.
- Handles outliers effectively: Outliers have less influence on the results compared to parametric tests.
- Suitable for ordinal data: Can be used when data is ranked rather than measured on an interval or ratio scale.
- Relatively easy to understand and calculate: The calculations, although slightly more involved than a t-test, are manageable.
Disadvantages:
- Less powerful than parametric tests (when assumptions of parametric tests are met): If your data is normally distributed, a t-test will generally have greater statistical power.
- Can be less precise: Because it deals with ranks rather than raw data, it loses some information, leading to potentially less precise conclusions than parametric tests.
- Can be computationally intensive for extremely large datasets: While manageable for moderate sample sizes, extremely large datasets might require computational tools.
Practical Applications
The Mann-Whitney U test finds wide application across various fields, including:
- Medicine: Comparing the effectiveness of two different treatments.
- Psychology: Assessing the difference in performance between two groups undergoing different interventions.
- Education: Analyzing the difference in test scores between students from different schools or learning styles.
- Environmental science: Comparing pollution levels in two different regions.
- Business: Evaluating the effectiveness of two different marketing strategies.
Conclusion
The Mann-Whitney U test is a powerful and versatile tool for comparing two independent groups when the assumptions of parametric tests are not met. Understanding the formula, steps involved, and interpretation of the results is crucial for effective application in various fields. Remember to consider both statistical significance and effect size when drawing conclusions from your analysis. While the calculations can be done manually, statistical software packages readily perform these calculations and provide p-values and effect sizes, making the process considerably simpler for large datasets. Always consider the nature of your data and research question when deciding which statistical test is most appropriate.
Latest Posts
Latest Posts
-
Does A Monopolist Have A Supply Curve
Mar 28, 2025
-
Image Of Plant And Animal Cell
Mar 28, 2025
-
What Are The Units Of Entropy
Mar 28, 2025
-
When Can You Use Henderson Hasselbalch Equation
Mar 28, 2025
-
What Are Monomers Of Nucleic Acids
Mar 28, 2025
Related Post
Thank you for visiting our website which covers about Formula For Mann Whitney U Test . We hope the information provided has been useful to you. Feel free to contact us if you have any questions or need further assistance. See you next time and don't miss to bookmark.
