How Do You Make A Standard Curve
Muz Play
Mar 29, 2025 · 7 min read
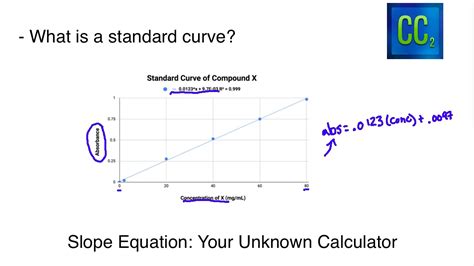
Table of Contents
How to Make a Standard Curve: A Comprehensive Guide
A standard curve, also known as a calibration curve, is a crucial tool in analytical chemistry and many other scientific fields. It's a graphical representation of the relationship between the known concentrations of a substance (the standard) and a measurable signal, such as absorbance or fluorescence. Creating a reliable standard curve is essential for accurately determining the concentration of an unknown sample. This comprehensive guide will walk you through the process, from planning and preparation to analysis and interpretation, ensuring you can create accurate and reliable standard curves for your experiments.
1. Planning and Preparation: Laying the Foundation for Success
Before you even begin preparing your solutions, careful planning is crucial. This stage ensures your standard curve is both accurate and efficient.
1.1 Defining Your Objective and Choosing the Right Method
-
What are you measuring? Understanding the analyte (the substance you're measuring) is paramount. Different analytes require different detection methods. Common methods include spectrophotometry (measuring absorbance or transmittance of light), fluorometry (measuring fluorescence intensity), chromatography (measuring peak areas), and electrochemical methods (measuring current or voltage).
-
What is your expected concentration range? Your standard curve needs to cover the expected concentration range of your unknown samples. If you choose a range that's too narrow, you'll lack accuracy for samples outside that range; too wide, and you might sacrifice precision in your measurements at lower concentrations.
-
How many standards do you need? A minimum of five to seven standards is generally recommended. This provides sufficient data points for a reliable curve fit, especially if your relationship isn't perfectly linear. More standards can increase accuracy, but diminishing returns set in after a certain point.
-
What is your desired level of accuracy? The desired accuracy will influence the number of replicates you prepare for each standard. More replicates lead to a better understanding of the variability in your measurements and a more robust standard curve.
1.2 Preparing Standard Solutions
This involves carefully preparing a series of solutions with precisely known concentrations of your analyte. This is the most crucial step, so meticulous attention to detail is essential.
-
Accurate Weighing: Use an analytical balance capable of measuring to at least three decimal places to weigh out your analyte accurately. The accuracy of your weighings directly impacts the accuracy of your entire standard curve.
-
Appropriate Solvent: Choose a solvent that readily dissolves your analyte and is compatible with your chosen detection method. The purity of the solvent is also vital. Impurities can introduce significant errors.
-
Serial Dilutions: Serial dilutions are often the most efficient way to prepare a series of standard solutions. This involves creating a stock solution of the highest concentration and then successively diluting it to create lower concentrations. Using volumetric flasks and pipettes will minimize error. Remember to account for dilution factors carefully.
-
Proper Mixing: Thoroughly mix each solution after preparing it to ensure uniform concentration.
2. Data Acquisition: Measuring the Signal
Once you have your standard solutions prepared, it's time to obtain the measurements that will form the basis of your standard curve.
2.1 Instrument Calibration and Blank Correction
-
Instrument Calibration: Before beginning any measurements, always calibrate your instrument according to the manufacturer's instructions. This ensures that your instrument is functioning correctly and providing accurate readings.
-
Blank Correction: A blank solution (containing only the solvent) is crucial for correcting for background signal. Measure the signal from the blank and subtract this value from all your standard and unknown sample readings. This compensates for any absorbance or fluorescence from the solvent or cuvette.
2.2 Measuring the Signal for Each Standard
Carefully measure the signal (absorbance, fluorescence, peak area, etc.) for each of your standard solutions. Remember to replicate each measurement several times (at least three) to account for experimental variability. Record all measurements meticulously in a laboratory notebook or spreadsheet.
3. Data Analysis and Curve Fitting: Constructing the Standard Curve
After acquiring your data, you need to analyze it and generate the standard curve.
3.1 Data Presentation and Visual Inspection
Organize your data in a table or spreadsheet, including the concentration of each standard and the corresponding average signal with standard deviation. Creating a scatter plot of the data (concentration on the x-axis and signal on the y-axis) is the first step in visualization. This allows for a visual inspection for outliers or trends that might suggest problems in your data acquisition.
3.2 Choosing the Right Curve Fitting Method
The appropriate curve fitting method depends on the relationship between concentration and signal. Most standard curves follow a linear relationship, especially at lower concentrations. However, some analytes exhibit non-linear behaviour, especially at higher concentrations.
-
Linear Regression: If your data shows a linear relationship, a linear regression (least-squares method) is appropriate. This method finds the best-fitting straight line through your data points. The equation of this line (y = mx + c, where y is the signal, x is the concentration, m is the slope, and c is the y-intercept) is essential for determining unknown concentrations.
-
Non-linear Regression: If your data exhibits a non-linear relationship (e.g., sigmoidal or quadratic), more sophisticated non-linear regression methods are necessary. These often require specialized software.
3.3 Assessing the Quality of the Standard Curve
Several parameters help assess the quality of your standard curve.
-
R-squared Value (R²): For linear regression, the R-squared value indicates the goodness of fit. A value close to 1 indicates a strong linear relationship. However, a high R² doesn't guarantee a good curve if other aspects, such as outliers, are present.
-
Outliers: Identify and investigate any outliers (data points that significantly deviate from the trend). Determine if there were errors in measurement or preparation. Removing outliers may be necessary but should be justified.
-
Linear Range: The linear range is the concentration range over which the relationship between concentration and signal is linear. This is crucial for determining the reliable range for unknown sample analysis.
-
Standard Deviation: The standard deviation of the replicates for each standard provides insight into the reproducibility of your measurements. A small standard deviation indicates high reproducibility.
4. Determining Unknown Concentrations: Utilizing the Standard Curve
Once you have a reliable standard curve, you can use it to determine the concentration of an unknown sample.
4.1 Measuring the Signal of the Unknown Sample
Measure the signal of your unknown sample using the same method and under the same conditions as your standards. Replicate the measurements several times for improved accuracy.
4.2 Using the Standard Curve Equation
If your standard curve is linear, use the equation obtained from the linear regression (y = mx + c) to calculate the concentration of the unknown. Substitute the measured signal (y) into the equation and solve for the concentration (x).
4.3 Interpolation vs. Extrapolation
-
Interpolation: It's generally best to use the standard curve for interpolation – estimating values within the range of the standards.
-
Extrapolation: Extrapolating beyond the range of the standards is less reliable. It's preferable to prepare additional standards if the unknown's signal falls outside the established range.
5. Troubleshooting Common Issues
Creating a standard curve can present challenges. Here's how to troubleshoot common problems:
5.1 Non-linearity
If your data is non-linear, consider:
- Concentration range: Adjust the concentration range of your standards.
- Method suitability: Ensure the chosen method is appropriate for the analyte and concentration range.
- Interferences: Check for interferences that might affect the signal.
- Non-linear regression: Employ non-linear regression analysis if a non-linear relationship is inherent.
5.2 High Standard Deviation
If your data shows high standard deviation, consider:
- Pipetting technique: Ensure accurate pipetting techniques are followed.
- Solution preparation: Ensure solutions are prepared carefully and thoroughly mixed.
- Instrument stability: Check the stability of your measuring instrument.
- Sample handling: Ensure consistent sample handling procedures to minimize variability.
5.3 Outliers
Outliers can arise from various factors. Consider:
- Measurement errors: Repeat measurements to rule out errors.
- Contamination: Ensure cleanliness of glassware and reagents.
- Sample heterogeneity: Ensure the sample is homogeneous.
6. Conclusion: The Importance of Accurate Standard Curves
Creating a well-designed and carefully executed standard curve is crucial for accurate and reliable analytical measurements. By carefully following the steps outlined in this guide, you can ensure that your experiments yield precise and trustworthy results, contributing significantly to the accuracy and reliability of your research or analysis. Remember, meticulous attention to detail throughout the entire process, from preparation to analysis, is key to the success of your standard curve and its use in determining unknown concentrations.
Latest Posts
Latest Posts
-
Lewis Dot Diagram For 2 Individual Ions For Na
Apr 01, 2025
-
Three Stages Of The Perception Process
Apr 01, 2025
-
Difference Between Solution Suspension And Colloid
Apr 01, 2025
-
Does A Trout Have Upright Erect Posture
Apr 01, 2025
-
What Holds The Hydrogen Atoms To The Oxygen Atom
Apr 01, 2025
Related Post
Thank you for visiting our website which covers about How Do You Make A Standard Curve . We hope the information provided has been useful to you. Feel free to contact us if you have any questions or need further assistance. See you next time and don't miss to bookmark.
