How To Calculate Expected Frequency In Chi Square
Muz Play
Mar 15, 2025 · 5 min read
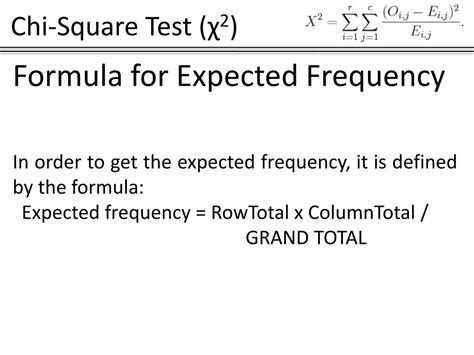
Table of Contents
How to Calculate Expected Frequency in Chi-Square: A Comprehensive Guide
The chi-square test is a powerful statistical tool used to analyze categorical data. It determines whether there's a significant association between two categorical variables or whether a sample distribution matches an expected distribution. A crucial step in performing a chi-square test is calculating the expected frequencies. Understanding how to calculate these expected values is paramount to correctly interpreting your results. This comprehensive guide will walk you through the process, covering various scenarios and providing practical examples.
Understanding Expected Frequency
Before diving into the calculations, let's clarify what expected frequency means. In the context of a chi-square test, the expected frequency represents the number of observations you would expect in each category if there were no relationship between the variables (for a test of independence) or if the sample distribution perfectly matched the expected distribution (for a goodness-of-fit test). It's a theoretical value, based on the marginal totals of your data. The difference between observed and expected frequencies is what drives the chi-square statistic. A large difference suggests a significant association or deviation from the expected distribution.
Calculating Expected Frequency: Different Scenarios
The method for calculating expected frequencies varies slightly depending on the type of chi-square test being performed. Let's examine the most common scenarios:
1. Chi-Square Test of Independence
This test assesses whether two categorical variables are independent. For example, you might want to determine if there's a relationship between gender and preference for a particular brand of coffee.
Formula:
The expected frequency for each cell in the contingency table is calculated using the following formula:
Expected Frequency (E) = (Row Total * Column Total) / Grand Total
Where:
- Row Total: The sum of the observed frequencies in the corresponding row.
- Column Total: The sum of the observed frequencies in the corresponding column.
- Grand Total: The total number of observations in the entire table.
Example:
Let's say we're investigating the relationship between gender and coffee preference (Brand A vs. Brand B). Our observed data is as follows:
| Brand A | Brand B | Row Total | |
|---|---|---|---|
| Male | 30 | 20 | 50 |
| Female | 25 | 35 | 60 |
| Column Total | 55 | 55 | 110 |
To calculate the expected frequency for males preferring Brand A:
E = (50 * 55) / 110 = 25
Similarly, we can calculate the expected frequencies for all the other cells:
- Males preferring Brand B:
E = (50 * 55) / 110 = 25 - Females preferring Brand A:
E = (60 * 55) / 110 = 30 - Females preferring Brand B:
E = (60 * 55) / 110 = 30
Therefore, our table of expected frequencies would look like this:
| Brand A | Brand B | Row Total | |
|---|---|---|---|
| Male | 25 | 25 | 50 |
| Female | 30 | 30 | 60 |
| Column Total | 55 | 55 | 110 |
2. Chi-Square Goodness-of-Fit Test
This test determines whether a sample distribution conforms to a hypothesized distribution. For example, you might test whether the distribution of colors in a bag of candies matches the manufacturer's claimed distribution.
Formula:
The expected frequency for each category is calculated by multiplying the total number of observations by the expected proportion for that category.
Expected Frequency (E) = Total Number of Observations * Expected Proportion
Example:
A manufacturer claims that their bag of candies contains 25% red, 25% blue, 25% green, and 25% yellow candies. You purchase a bag and count the candies: 20 red, 15 blue, 25 green, and 20 yellow. The total is 80.
To calculate the expected frequency for red candies:
E = 80 * 0.25 = 20
Similarly:
- Blue:
E = 80 * 0.25 = 20 - Green:
E = 80 * 0.25 = 20 - Yellow:
E = 80 * 0.25 = 20
In this case, the expected frequencies align with the manufacturer's claim. The chi-square test would then evaluate whether the observed differences are statistically significant.
Interpreting Expected Frequencies
The expected frequencies are crucial for calculating the chi-square statistic (χ²):
χ² = Σ [(O - E)² / E]
Where:
- O: Observed frequency
- E: Expected frequency
- Σ: Summation across all categories
A high chi-square value indicates a significant difference between observed and expected frequencies, suggesting a relationship between variables (test of independence) or a deviation from the expected distribution (goodness-of-fit test). The significance of the chi-square value is determined by comparing it to a critical value from the chi-square distribution table, considering the degrees of freedom.
Important Considerations when Calculating Expected Frequencies
-
Cell counts: The chi-square test is most reliable when the expected frequencies in each cell are sufficiently large. A common rule of thumb is that all expected frequencies should be at least 5. If this condition is not met, you might need to consider alternative statistical tests or combine categories to meet the requirement.
-
Assumptions: The chi-square test assumes that the observations are independent and the data are categorical.
-
Software: Statistical software packages (like SPSS, R, or Python's SciPy) can automate the calculation of expected frequencies and the entire chi-square test, making the process much more efficient.
Advanced Applications and Scenarios
While the examples above demonstrate the basic calculations, understanding the principles allows you to adapt them to more complex scenarios:
-
Stratified Samples: When analyzing data from stratified samples (e.g., surveying different age groups), you’ll need to calculate expected frequencies within each stratum before combining results.
-
Multiple Variables: While the examples focused on two variables, the chi-square test can extend to scenarios with three or more categorical variables. The calculation of expected frequencies becomes more involved but follows the same fundamental principles.
-
Testing Specific Hypotheses: In some cases, you may want to test specific hypotheses regarding the proportions in a categorical variable. The calculation of expected frequencies will be informed by those hypotheses.
Conclusion
Calculating expected frequencies is a fundamental aspect of performing a chi-square test. By accurately determining these values, you lay the foundation for a valid and reliable statistical analysis. This guide has provided a comprehensive understanding of the concepts and calculations involved. Remember that using statistical software can simplify the process, but understanding the underlying principles remains critical for interpreting the results effectively and drawing meaningful conclusions. Through careful calculation and interpretation, the chi-square test can provide valuable insights into the relationships between categorical variables.
Latest Posts
Latest Posts
-
How To Find A Perpendicular Vector
Mar 15, 2025
-
How Could Sulfur Form An Ion
Mar 15, 2025
-
What Elemsnts Are Most Likey To Turn Into Anions Why
Mar 15, 2025
-
What Is The Difference Between Hunger And Appetite
Mar 15, 2025
-
Boiling Point On Graph In Celsius
Mar 15, 2025
Related Post
Thank you for visiting our website which covers about How To Calculate Expected Frequency In Chi Square . We hope the information provided has been useful to you. Feel free to contact us if you have any questions or need further assistance. See you next time and don't miss to bookmark.
