How To Find Initial Velocity Enzymes Lineweaver Burk
Muz Play
Mar 15, 2025 · 6 min read
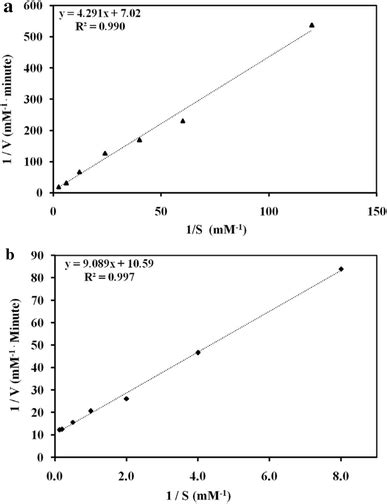
Table of Contents
How to Find the Initial Velocity of Enzymes Using the Lineweaver-Burk Plot
The Lineweaver-Burk plot, also known as the double reciprocal plot, is a graphical representation of the Michaelis-Menten equation. It's a valuable tool in enzymology for determining key kinetic parameters, especially the initial velocity (V₀) of an enzymatic reaction. Understanding how to extract V₀ from this plot is crucial for comprehending enzyme kinetics and designing experiments. This comprehensive guide will delve into the intricacies of using the Lineweaver-Burk plot to find the initial velocity, highlighting its advantages and limitations.
Understanding the Michaelis-Menten Equation and its Transformation
Before diving into the Lineweaver-Burk plot, it's essential to grasp the fundamental Michaelis-Menten equation:
V₀ = (Vₘₐₓ[S]) / (Kₘ + [S])
Where:
- V₀ represents the initial reaction velocity. This is the rate of product formation at the very beginning of the reaction, before a significant amount of substrate is consumed. It's typically measured as the change in product concentration per unit time (e.g., µmol/min).
- Vₘₐₓ is the maximum reaction velocity. This is the theoretical maximum rate achieved when all enzyme active sites are saturated with substrate.
- [S] denotes the initial substrate concentration.
- Kₘ (Michaelis constant) represents the substrate concentration at which the reaction velocity is half of Vₘₐₓ. It's a measure of the enzyme's affinity for its substrate; a lower Kₘ indicates higher affinity.
The Michaelis-Menten equation, while fundamental, isn't always the easiest to analyze graphically. This is where the Lineweaver-Burk plot comes into play. It's derived by taking the reciprocal of the Michaelis-Menten equation:
1/V₀ = (Kₘ/Vₘₐₓ)(1/[S]) + 1/Vₘₐₓ
This transformed equation is in the form of y = mx + c, the equation of a straight line, where:
- y = 1/V₀
- x = 1/[S]
- m = Kₘ/Vₘₐₓ (slope)
- c = 1/Vₘₐₓ (y-intercept)
Constructing the Lineweaver-Burk Plot: A Step-by-Step Guide
Constructing an accurate Lineweaver-Burk plot is crucial for reliable determination of kinetic parameters. Here's a detailed step-by-step guide:
1. Conducting the Enzyme Assay: Gathering the Data
This involves performing a series of enzyme assays with varying substrate concentrations ([S]). For each assay, measure the initial reaction velocity (V₀). It's vital to ensure that the measurements are taken during the initial linear phase of the reaction, before substrate depletion significantly affects the rate. Multiple replicates for each substrate concentration are strongly recommended to improve data reliability and minimize experimental error.
2. Calculating Reciprocals: Transforming the Data
Once you have your V₀ values for each substrate concentration, calculate the reciprocals (1/V₀ and 1/[S]) for each data point. This is essential for plotting the Lineweaver-Burk graph. Accurate calculations are critical for the accuracy of your final results. Spreadsheet software like Excel or Google Sheets can greatly simplify this step.
3. Plotting the Data: Creating the Lineweaver-Burk Plot
Plot 1/V₀ (y-axis) against 1/[S] (x-axis). The resulting plot should be a straight line. Use appropriate graphing software or tools to ensure accuracy and clarity. Proper labeling of axes and inclusion of a title are essential for scientific rigor.
4. Determining the y-intercept: Finding 1/Vₘₐₓ
The y-intercept of the line represents 1/Vₘₐₓ. Find this value by visually inspecting the graph where the line intersects the y-axis, or by using linear regression analysis (as described below). The reciprocal of this value (1/(y-intercept)) will provide you with Vₘₐₓ, the maximum reaction velocity.
5. Determining the x-intercept: Finding -1/Kₘ
The x-intercept represents -1/Kₘ. Find the value by visually inspecting where the line crosses the x-axis, or through linear regression. Taking the negative reciprocal of this value (-1/(x-intercept)) will yield Kₘ, the Michaelis constant.
6. Utilizing Linear Regression: Improving Accuracy
While visual inspection can provide an estimate, linear regression analysis offers greater accuracy. This statistical method finds the line of best fit through your data points, providing a more precise determination of the slope (Kₘ/Vₘₐₓ) and y-intercept (1/Vₘₐₓ). Most spreadsheet software packages include built-in linear regression functions.
Finding Initial Velocity (V₀) from the Lineweaver-Burk Plot
While the primary purpose of the Lineweaver-Burk plot isn't directly to determine a single V₀, understanding the relationship between the plot and the initial velocity is crucial. You can determine V₀ for any substrate concentration from the equation of the line obtained through linear regression:
1/V₀ = (Kₘ/Vₘₐₓ)(1/[S]) + 1/Vₘₐₓ
-
Obtain the equation of the line: From linear regression analysis, you'll get the equation of the line in the form y = mx + c, where m = Kₘ/Vₘₐₓ and c = 1/Vₘₐₓ.
-
Substitute the desired [S]: Insert the desired substrate concentration ([S]) into the equation. Remember to use the reciprocal (1/[S]).
-
Calculate 1/V₀: Solve the equation to find 1/V₀.
-
Calculate V₀: Take the reciprocal of the calculated 1/V₀ to obtain the initial velocity (V₀) for that specific substrate concentration.
Advantages and Limitations of the Lineweaver-Burk Plot
The Lineweaver-Burk plot, despite its widespread use, has certain strengths and weaknesses:
Advantages:
- Simple visualization: Provides a straightforward graphical representation of enzyme kinetics.
- Easy determination of Kₘ and Vₘₐₓ: The intercepts directly provide these crucial kinetic parameters.
- Useful for comparing different enzyme kinetics: facilitates a quick visual comparison.
Limitations:
- Data Transformation Bias: Taking reciprocals can disproportionately weight data points with low V₀ values, leading to inaccuracies, especially at high substrate concentrations.
- Error Propagation: Errors in V₀ measurements are magnified when reciprocals are taken.
- Extrapolation Issues: Determining the intercepts involves extrapolation, which can be imprecise, particularly the x-intercept (-1/Kₘ).
Alternatives to the Lineweaver-Burk Plot
Due to the limitations of the Lineweaver-Burk plot, other methods for analyzing enzyme kinetics exist, including:
- Eadie-Hofstee Plot: Plots V₀ against V₀/[S]. Less susceptible to error magnification than the Lineweaver-Burk plot.
- Hanes-Woolf Plot: Plots [S]/V₀ against [S]. Also less susceptible to error magnification.
- Direct non-linear regression: Fitting the Michaelis-Menten equation directly to the data using non-linear regression software. This is considered the most accurate method but requires specialized software.
Conclusion
The Lineweaver-Burk plot offers a valuable tool for visualizing and analyzing enzyme kinetics, particularly for determining Kₘ and Vₘₐₓ. However, it's crucial to be aware of its limitations, especially the potential for error magnification and extrapolation issues. Careful experimental design, accurate data collection, and the use of linear regression analysis are essential for minimizing errors. While it provides a clear visual representation and allows for easy calculation of kinetic parameters, consider using alternative methods like the Eadie-Hofstee or Hanes-Woolf plots, or even direct non-linear regression, to improve accuracy and overcome some inherent limitations. The choice of method depends on the data quality and the specific needs of the research. Remember that understanding the strengths and weaknesses of each approach is key to obtaining reliable results in enzyme kinetics studies.
Latest Posts
Latest Posts
-
Do Valence Electrons Have The Most Energy
Mar 17, 2025
-
Element Vs Compound Vs Homogeneous Vs Heterogeneous
Mar 17, 2025
-
For An Exothermic Reaction The Products
Mar 17, 2025
-
Fallacies Divide Into Roughly Two Kinds
Mar 17, 2025
-
An Organism That Cannot Grow Without Oxygen Is A An
Mar 17, 2025
Related Post
Thank you for visiting our website which covers about How To Find Initial Velocity Enzymes Lineweaver Burk . We hope the information provided has been useful to you. Feel free to contact us if you have any questions or need further assistance. See you next time and don't miss to bookmark.
