How To Read A Potential Energy Graph
Muz Play
Mar 28, 2025 · 6 min read
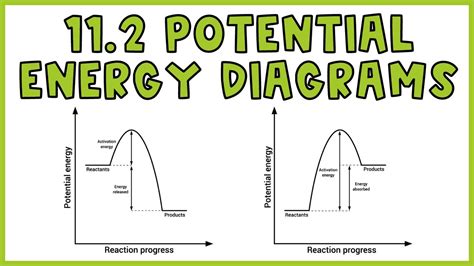
Table of Contents
How to Read a Potential Energy Graph: A Comprehensive Guide
Potential energy graphs are powerful visual tools used in physics and chemistry to represent the energy landscape of a system. Understanding how to interpret these graphs is crucial for comprehending concepts like stability, equilibrium, and reaction pathways. This comprehensive guide will equip you with the skills to confidently analyze potential energy diagrams, regardless of your level of expertise.
Understanding the Axes and Basic Components
Before diving into complex scenarios, let's establish the fundamental elements of a potential energy graph. These graphs typically have two axes:
-
X-axis (Horizontal): This axis usually represents the reaction coordinate or a distance parameter. In chemical reactions, it might depict the progress of a reaction from reactants to products. In physics, it could represent the distance between two interacting particles. The specific meaning depends on the system being modeled.
-
Y-axis (Vertical): This axis always represents the potential energy of the system. The energy is typically expressed in joules (J) or kilojoules (kJ), but the units can vary depending on the context. A higher value on the Y-axis indicates a higher potential energy.
A typical graph will show a curve illustrating how the potential energy changes as a function of the reaction coordinate or distance.
Identifying Key Features: Minima, Maxima, and Equilibrium
The shape of the potential energy curve reveals crucial information about the system's stability and behavior. Three key features are particularly important:
1. Minima (Valleys):
-
Meaning: Minima represent stable equilibrium points. At these points, the system is at its lowest potential energy for a given region of the reaction coordinate. Any small displacement from the minimum will result in a restoring force that pushes the system back towards the minimum. Think of a ball resting at the bottom of a bowl – it's stable.
-
Identification: Minima appear as the lowest points on the curve, where the slope is zero (the tangent line is horizontal).
-
Significance: Minima correspond to stable configurations of the system, such as stable molecules or stable physical arrangements.
2. Maxima (Peaks):
-
Meaning: Maxima represent unstable equilibrium points, also known as transition states or activated complexes in the context of chemical reactions. At these points, the system is at its highest potential energy for a given region of the reaction coordinate. Any small displacement from the maximum will result in the system moving away from the maximum, towards a lower energy state. Think of a ball balanced on the top of a hill – it's highly unstable.
-
Identification: Maxima appear as the highest points on the curve, where the slope is also zero.
-
Significance: Maxima represent points of high energy along a reaction pathway. The difference in energy between a minimum and a maximum represents the activation energy – the energy barrier that must be overcome for a reaction to occur.
3. Equilibrium Points:
-
Meaning: Equilibrium points are where the system is at a state of balance. This includes both stable (minima) and unstable (maxima) equilibrium.
-
Identification: Identified by finding the points where the derivative of the potential energy with respect to the reaction coordinate is zero (slope is zero).
Interpreting Potential Energy Diagrams: Examples and Applications
Let's explore various scenarios and applications to illustrate how to extract valuable insights from potential energy graphs.
1. Chemical Reactions:
A potential energy diagram for a chemical reaction typically shows the energy change as reactants transform into products.
-
Reactants: Represented by a minimum on the left side of the graph.
-
Products: Represented by a minimum on the right side of the graph.
-
Transition State: The maximum between the reactant and product minima represents the transition state (activated complex), the highest-energy point along the reaction pathway.
-
Activation Energy (Ea): The energy difference between the reactant minimum and the transition state maximum. A higher activation energy indicates a slower reaction rate, as more energy is required to reach the transition state.
-
Enthalpy Change (ΔH): The energy difference between the reactant minimum and the product minimum. A negative ΔH indicates an exothermic reaction (releases heat), while a positive ΔH indicates an endothermic reaction (absorbs heat).
2. Molecular Interactions:
Potential energy graphs are also used to describe the interactions between molecules or atoms.
-
Attractive Forces: As two atoms or molecules approach each other, attractive forces initially decrease their potential energy, causing the graph to slope downward.
-
Repulsive Forces: At very short distances, repulsive forces become dominant, causing a sharp increase in potential energy.
-
Equilibrium Bond Length: The minimum on the curve corresponds to the equilibrium bond length, the distance between atoms or molecules where the attractive and repulsive forces are balanced. The depth of the minimum represents the bond strength.
3. Simple Harmonic Motion:
In physics, the potential energy of a simple harmonic oscillator (like a mass on a spring) is described by a parabolic curve.
-
Equilibrium Position: The minimum of the parabola represents the equilibrium position, where the potential energy is at its minimum.
-
Displacement: The x-axis represents the displacement from the equilibrium position.
-
Restoring Force: The slope of the curve at any point is proportional to the restoring force acting on the oscillator.
Advanced Concepts and Considerations
While the basics cover many scenarios, several advanced considerations refine our understanding:
Multiple Minima and Reaction Pathways:
Some potential energy diagrams exhibit multiple minima, representing different stable states or isomers. The system might transition between these minima through specific reaction pathways, each with its own transition states and activation energies. Analyzing these pathways is essential for understanding complex chemical transformations or physical processes.
Tunneling:
In certain quantum mechanical systems, particles can tunnel through potential energy barriers even if they don't possess sufficient energy to overcome them classically. This phenomenon is not directly visible on a classical potential energy graph but needs to be considered when dealing with quantum systems.
Temperature Effects:
Temperature influences the system's ability to overcome energy barriers. At higher temperatures, more particles have sufficient energy to reach the transition state, leading to faster reaction rates. This isn't explicitly shown on a simple potential energy graph but must be considered when interpreting reaction kinetics.
Different Coordinate Systems:
While the reaction coordinate is often abstract, in specific cases it might represent a more concrete quantity like bond length, dihedral angle, or distance between two particles. The choice of coordinate system significantly affects the shape and interpretation of the potential energy diagram.
Practical Tips for Analyzing Potential Energy Graphs
-
Label Axes and Units: Ensure the axes are clearly labeled with appropriate units. This provides crucial context for interpretation.
-
Identify Key Features: Systematically locate minima, maxima, and other relevant points on the curve.
-
Analyze Energy Differences: Calculate the activation energy, enthalpy changes, or other energy differences as needed. These values provide quantitative insights into the system's behavior.
-
Relate to Physical Properties: Connect the features of the graph to the physical or chemical properties of the system being modeled. This helps solidify understanding and provides meaningful context.
-
Use Multiple Views: Consider exploring different graphical representations such as 3D potential energy surfaces (for systems with multiple degrees of freedom) to gain a richer perspective.
By mastering the art of reading potential energy graphs, you'll gain a deeper understanding of the energy landscapes governing physical and chemical systems. Remember that practice is key. Work through various examples, and gradually you will become proficient in extracting valuable information from these essential diagrams. The more you practice, the more intuitive and insightful the process will become.
Latest Posts
Latest Posts
-
According To The Rules Of Osmosis A System Will
Mar 31, 2025
-
Where Are Chondrocytes And Osteocytes Located
Mar 31, 2025
-
List The Types Of Persuasive Speeches
Mar 31, 2025
-
The Energy Needed To Start A Chemical Reaction Is Called
Mar 31, 2025
-
Person In Environment In Social Work
Mar 31, 2025
Related Post
Thank you for visiting our website which covers about How To Read A Potential Energy Graph . We hope the information provided has been useful to you. Feel free to contact us if you have any questions or need further assistance. See you next time and don't miss to bookmark.
