Is Standard Deviation A Measure Of Center Or Variation
Muz Play
Mar 26, 2025 · 6 min read
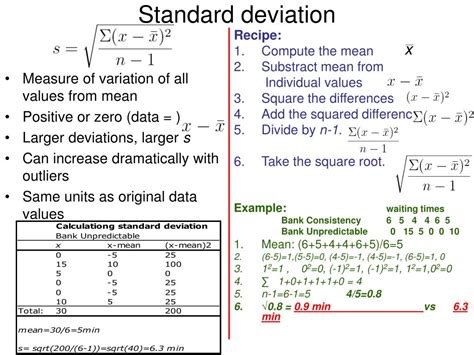
Table of Contents
Is Standard Deviation a Measure of Center or Variation? A Deep Dive
Standard deviation is a fundamental concept in statistics, frequently used to describe the spread or dispersion of a dataset. However, a common point of confusion arises: is standard deviation a measure of the center of a dataset, or is it a measure of its variation? The answer, unequivocally, is that standard deviation is a measure of variation, not center. This article will delve deep into this distinction, exploring the definitions of both central tendency and variability, explaining how standard deviation quantifies dispersion, and addressing common misconceptions.
Understanding Measures of Central Tendency
Before we definitively address the role of standard deviation, let's clarify what constitutes a measure of the center of a dataset. Measures of central tendency aim to identify a single value that best represents the typical or average value within a dataset. The most common measures of central tendency include:
- Mean: The arithmetic average, calculated by summing all values and dividing by the number of values. It's highly sensitive to outliers.
- Median: The middle value when the data is ordered. It's less sensitive to outliers than the mean.
- Mode: The value that appears most frequently. It's useful for categorical data but less so for continuous data.
These measures all attempt to pinpoint the center or typical value within a distribution. They tell us nothing about how spread out or clustered the data points are around this central value. This is where measures of variation come into play.
Measures of Variation: Quantifying Dispersion
Measures of variation describe the extent to which data points are spread out around the center. A high degree of variation indicates that data points are widely dispersed, while low variation suggests they cluster closely around the central tendency. Common measures of variation include:
- Range: The difference between the maximum and minimum values. It's simple to calculate but highly sensitive to outliers.
- Interquartile Range (IQR): The difference between the 75th percentile (third quartile) and the 25th percentile (first quartile). It's less sensitive to outliers than the range.
- Variance: The average of the squared differences between each data point and the mean. It provides a measure of the overall dispersion but is in squared units.
- Standard Deviation: The square root of the variance. This brings the measure back to the original units of the data, making it more interpretable.
Standard Deviation: A Detailed Explanation
The standard deviation, often represented by the Greek letter sigma (σ) for population standard deviation and 's' for sample standard deviation, is arguably the most widely used measure of variation. It quantifies the average distance of data points from the mean. A higher standard deviation signifies greater dispersion; data points are, on average, farther from the mean. Conversely, a lower standard deviation indicates that data points are clustered closely around the mean.
Calculation of Standard Deviation:
The calculation of standard deviation involves several steps:
- Calculate the mean (µ or x̄) of the dataset.
- Find the difference between each data point and the mean (xᵢ - µ or xᵢ - x̄).
- Square each of these differences (xᵢ - µ)² or (xᵢ - x̄)². This crucial step ensures that both positive and negative deviations contribute positively to the overall dispersion.
- Calculate the average of these squared differences. This is the variance (σ² or s²).
- Take the square root of the variance. This is the standard deviation (σ or s).
The formula for population standard deviation (σ) is:
σ = √[Σ(xᵢ - µ)² / N]
Where:
- xᵢ represents each individual data point.
- µ represents the population mean.
- N represents the total number of data points in the population.
The formula for sample standard deviation (s) is slightly different:
s = √[Σ(xᵢ - x̄)² / (n - 1)]
Where:
- xᵢ represents each individual data point.
- x̄ represents the sample mean.
- n represents the total number of data points in the sample. The (n-1) is used instead of n to provide an unbiased estimate of the population standard deviation.
Interpreting Standard Deviation:
Understanding the magnitude of the standard deviation in relation to the mean is crucial for proper interpretation. A standard deviation close to zero implies minimal variation, with data points tightly clustered around the mean. A large standard deviation, on the other hand, reveals substantial variability, suggesting data points are widely dispersed.
Why Standard Deviation is NOT a Measure of Center
It's vital to understand why standard deviation is not a measure of central tendency. The standard deviation's value is fundamentally tied to the spread of data points, not their average value. You can have two datasets with identical means but vastly different standard deviations, reflecting distinct levels of dispersion.
Consider these two datasets:
Dataset A: 10, 10, 10, 10, 10
Dataset B: 5, 10, 10, 10, 15
Both datasets have a mean of 10. However, Dataset A has a standard deviation of 0 (no variation), while Dataset B has a non-zero standard deviation (reflecting variation). The standard deviation tells us nothing about the central value; it exclusively describes how spread out the data is around that central value.
Common Misconceptions about Standard Deviation
Several misconceptions frequently surround standard deviation. Let's address some of the most prevalent:
- Standard deviation is always positive: This is true. Because it's the square root of a sum of squares, it can never be negative.
- A larger standard deviation means more outliers: While a larger standard deviation often indicates a greater possibility of outliers, it's not a direct measure of outliers. Outliers can dramatically inflate the standard deviation, but a high standard deviation doesn't automatically imply the presence of numerous outliers.
- Standard deviation is only useful for normally distributed data: While standard deviation is particularly informative for normally distributed data (where its interpretations are well-defined), it's applicable to any data type, regardless of its distribution. However, the interpretation might require careful consideration in non-normal distributions.
- Standard deviation is interchangeable with variance: While they are closely related (variance is the square of the standard deviation), they are not interchangeable. Variance is in squared units, making it less directly interpretable than the standard deviation, which is in the original units of measurement.
Standard Deviation in Real-World Applications
Standard deviation finds widespread applications across numerous fields:
- Finance: Assessing the risk associated with investments. A higher standard deviation implies greater volatility and risk.
- Manufacturing: Controlling the quality of products. A low standard deviation indicates consistent product quality.
- Healthcare: Monitoring patient vital signs. Changes in standard deviation can signal potential health problems.
- Research: Evaluating the variability in experimental results. A lower standard deviation suggests greater precision and reliability.
- Weather Forecasting: Predicting the variability in temperature or rainfall. Higher standard deviation signifies more unpredictable weather patterns.
Conclusion: Understanding the Role of Standard Deviation
In conclusion, standard deviation is undeniably a measure of variation, not a measure of central tendency. It provides a crucial insight into the spread and dispersion of data points around the mean. While the mean provides a central value, the standard deviation quantifies how the data points are distributed around that central value. Understanding this crucial distinction is paramount for correctly interpreting and applying statistical analyses in any field. Mastering standard deviation enables a deeper understanding of data variability, leading to better decision-making based on data-driven insights. Its wide applicability underscores its importance in statistical analysis and its crucial role in interpreting and drawing meaningful conclusions from datasets.
Latest Posts
Latest Posts
-
Draw A Resonance Structure That Places A Pi Bond
Mar 29, 2025
-
Concept Map Bone Formation And Growth
Mar 29, 2025
-
Which Is A Property Of Ionic Compounds
Mar 29, 2025
-
Center Of Pressure In Fluid Mechanics
Mar 29, 2025
-
What Are The Characteristics Of Liquid
Mar 29, 2025
Related Post
Thank you for visiting our website which covers about Is Standard Deviation A Measure Of Center Or Variation . We hope the information provided has been useful to you. Feel free to contact us if you have any questions or need further assistance. See you next time and don't miss to bookmark.
