Surplus And Shortage On A Graph
Muz Play
Mar 26, 2025 · 7 min read
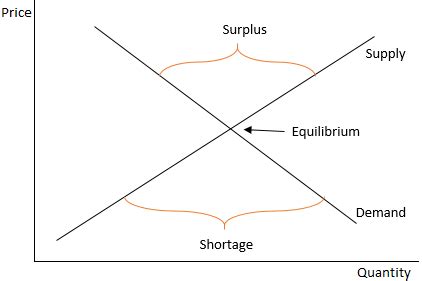
Table of Contents
Surplus and Shortage: A Graphical Analysis of Market Equilibrium
Understanding market equilibrium is fundamental to economics. It represents the point where supply and demand intersect, determining the market price and quantity of a good or service. However, markets don't always operate at this ideal equilibrium. Instead, they often experience periods of surplus and shortage, deviations from the equilibrium that significantly impact prices and market dynamics. This article will delve into the graphical representation and economic implications of surpluses and shortages.
Understanding Market Equilibrium: The Foundation
Before analyzing deviations, let's solidify our understanding of market equilibrium. The equilibrium point is where the quantity demanded by consumers equals the quantity supplied by producers. Graphically, this is represented by the intersection of the supply and demand curves.
The Demand Curve
The demand curve slopes downwards, illustrating the law of demand: as the price of a good decreases, the quantity demanded increases, and vice versa, all else being equal. This inverse relationship stems from several factors, including the substitution effect (consumers switch to cheaper alternatives) and the income effect (lower prices increase purchasing power).
The Supply Curve
Conversely, the supply curve slopes upwards, reflecting the law of supply: as the price of a good increases, the quantity supplied increases, and vice versa, all else being equal. This positive relationship arises because higher prices incentivize producers to increase production to capitalize on higher profits.
The Equilibrium Point
The intersection of the supply and demand curves represents the market equilibrium. At this point, the equilibrium price (P<sub>e</sub>) and equilibrium quantity (Q<sub>e</sub>) are established. At this price, the quantity consumers want to buy precisely matches the quantity producers want to sell. There's no pressure for the price to change.
Market Surplus: An Excess of Supply
A market surplus, also known as an excess supply, occurs when the quantity supplied exceeds the quantity demanded at a given price. This happens when the price is set above the equilibrium price.
Graphical Representation of Surplus
Graphically, a surplus is shown as the horizontal distance between the quantity supplied (Q<sub>s</sub>) and the quantity demanded (Q<sub>d</sub>) at a price above the equilibrium price (P > P<sub>e</sub>). This area represents the unsold goods or services.
(Insert a graph here showing a supply and demand curve with a surplus clearly marked. The graph should show the equilibrium price (Pe) and quantity (Qe), and a price (P) above Pe with Qs and Qd clearly marked to highlight the surplus.)
Economic Implications of Surplus
A surplus creates pressure on producers to lower prices to sell their excess inventory. This downward pressure continues until the price falls to the equilibrium level, eliminating the surplus. The surplus can lead to:
- Reduced Prices: Producers are forced to offer discounts, sales, and promotions to entice buyers.
- Increased Inventory Costs: Producers incur storage costs, potential spoilage, and obsolescence of unsold goods.
- Potential for Waste: In certain industries, particularly those with perishable goods, surpluses can lead to significant waste.
- Reduced Producer Profitability: Lower prices mean reduced profit margins for producers.
- Potential for Layoffs or Production Cuts: If the surplus persists, producers may reduce production or even lay off workers.
Market Shortage: An Excess of Demand
A market shortage, also known as an excess demand, occurs when the quantity demanded exceeds the quantity supplied at a given price. This happens when the price is set below the equilibrium price.
Graphical Representation of Shortage
Graphically, a shortage is shown as the horizontal distance between the quantity demanded (Q<sub>d</sub>) and the quantity supplied (Q<sub>s</sub>) at a price below the equilibrium price (P < P<sub>e</sub>). This area represents the unmet demand.
(Insert a graph here showing a supply and demand curve with a shortage clearly marked. The graph should show the equilibrium price (Pe) and quantity (Qe), and a price (P) below Pe with Qs and Qd clearly marked to highlight the shortage.)
Economic Implications of Shortage
A shortage creates upward pressure on prices as consumers compete for the limited supply. This upward pressure continues until the price rises to the equilibrium level, eliminating the shortage. The shortage can lead to:
- Increased Prices: Consumers are willing to pay more to obtain the scarce goods or services. This can lead to price gouging in extreme cases.
- Queuing and Rationing: Consumers may have to wait in line or participate in rationing systems to access the limited supply.
- Black Markets: Shortages can create opportunities for black markets where goods are sold illegally at inflated prices.
- Consumer Dissatisfaction: Consumers are frustrated by their inability to obtain the goods or services they desire.
- Potential for Increased Production: Higher prices incentivize producers to increase production to meet the high demand. However, this may take time, and the shortage may persist in the short term.
Factors Affecting Supply and Demand, and Subsequent Surpluses and Shortages
Various factors can shift the supply and demand curves, leading to changes in market equilibrium and creating either surpluses or shortages. These include:
Factors Shifting the Demand Curve:
- Changes in Consumer Income: Increased income generally leads to higher demand (normal goods) but can lead to lower demand for inferior goods.
- Changes in Consumer Tastes and Preferences: Fashion trends, technological advancements, and changing lifestyles can significantly alter demand.
- Changes in Prices of Related Goods: The price of substitute goods (e.g., Coke and Pepsi) and complementary goods (e.g., cars and gasoline) can impact demand.
- Changes in Consumer Expectations: Anticipated price increases or shortages can lead to increased current demand.
- Changes in the Number of Consumers: Population growth or migration can affect overall market demand.
Factors Shifting the Supply Curve:
- Changes in Input Prices: Increases in the cost of raw materials, labor, or energy can reduce supply.
- Changes in Technology: Technological advancements can increase efficiency and lower production costs, leading to increased supply.
- Changes in Government Policies: Taxes, subsidies, and regulations can significantly impact the supply of goods and services.
- Changes in Producer Expectations: Anticipated price changes can affect producers' willingness to supply goods in the current period.
- Changes in the Number of Producers: The entry or exit of firms from the market directly impacts the overall supply.
Interplay of Shifts and Equilibrium:
It's crucial to understand that shifts in either the supply or demand curve, or both, can simultaneously create surpluses or shortages. For instance, a decrease in demand combined with an increase in supply would result in a significant surplus. Conversely, an increase in demand coupled with a decrease in supply would lead to a substantial shortage. Analyzing these combined shifts requires careful consideration of the magnitude of each shift and their impact on the new equilibrium point.
Government Intervention: Price Controls
Governments sometimes intervene in markets through price controls, aiming to address perceived market failures or social concerns. These interventions can, however, inadvertently exacerbate surpluses or shortages.
Price Ceilings
A price ceiling is a maximum legal price that can be charged for a good or service. If set below the equilibrium price, it creates a binding price ceiling, leading to a shortage as the quantity demanded exceeds the quantity supplied.
Price Floors
A price floor is a minimum legal price that can be charged for a good or service. If set above the equilibrium price, it creates a binding price floor, leading to a surplus as the quantity supplied exceeds the quantity demanded.
(Insert two separate graphs here: one depicting a binding price ceiling and the resulting shortage, and another depicting a binding price floor and the resulting surplus.)
Both price ceilings and price floors distort market signals and can lead to unintended consequences, such as black markets, reduced quality, and inefficient allocation of resources. Therefore, they should be implemented cautiously and with careful consideration of the potential repercussions.
Conclusion: The Dynamic Nature of Market Equilibrium
Surpluses and shortages are inherent features of dynamic markets. They are temporary deviations from equilibrium caused by shifts in supply and demand or government intervention. Understanding the graphical representation and economic implications of these deviations is crucial for producers, consumers, and policymakers alike. Analyzing the interplay of supply and demand, anticipating potential shifts, and understanding the consequences of government intervention are essential for navigating the complexities of market dynamics and promoting efficient resource allocation. By recognizing the signals these market imbalances send, stakeholders can make informed decisions to mitigate negative impacts and capitalize on opportunities presented by shifting market conditions.
Latest Posts
Latest Posts
-
How To Find Point Of Tangency
Mar 29, 2025
-
How Do You Calculate Potential Difference
Mar 29, 2025
-
How To Round To Four Decimal Places
Mar 29, 2025
-
Reaction Of Benzoic Acid And Naoh
Mar 29, 2025
-
What Type Of Compounds Dissolve To Become Electrolyte
Mar 29, 2025
Related Post
Thank you for visiting our website which covers about Surplus And Shortage On A Graph . We hope the information provided has been useful to you. Feel free to contact us if you have any questions or need further assistance. See you next time and don't miss to bookmark.
