What Are Class Limits In Statistics
Muz Play
Mar 25, 2025 · 6 min read
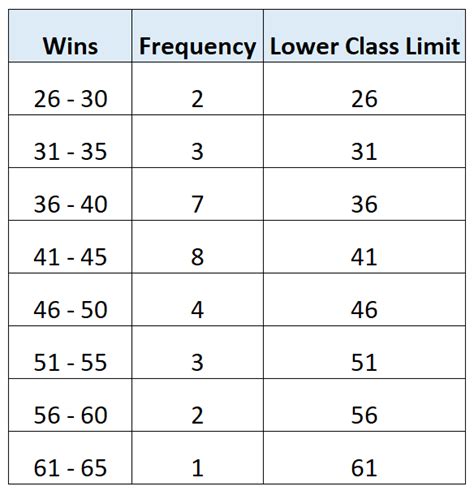
Table of Contents
What Are Class Limits in Statistics? A Comprehensive Guide
Understanding class limits is crucial for anyone working with grouped frequency distributions in statistics. This comprehensive guide will delve deep into the concept of class limits, exploring their various types, importance, and practical applications. We'll also address common misconceptions and provide clear examples to solidify your understanding.
Understanding Grouped Frequency Distributions
Before diving into class limits, let's establish the context. When dealing with large datasets, organizing the data into a frequency distribution table is essential for efficient analysis. A frequency distribution shows how often each value (or range of values) appears in a dataset. Sometimes, particularly with continuous data, it's impractical or inefficient to list every single data point individually. This is where grouped frequency distributions come in.
A grouped frequency distribution categorizes data into intervals, or classes, simplifying the data representation while retaining important information. Each class has an upper and lower limit defining its range. These limits are crucial for correctly interpreting the data and performing calculations.
Types of Class Limits
There are two primary types of class limits:
1. Apparent Class Limits
These are the values you explicitly see in a frequency distribution table. They are the stated boundaries of each class. For example, if a class is listed as "10-19," the apparent lower limit is 10, and the apparent upper limit is 19. Apparent class limits are straightforward but don't fully represent the true range of values included in each class.
2. Real Class Limits (or Actual Class Limits)
Real class limits represent the precise boundaries of each class, accounting for the gaps between consecutive classes. To determine the real class limits, we consider the precision of measurement. If the data is recorded to the nearest whole number, we add 0.5 to the upper apparent limit and subtract 0.5 from the lower apparent limit of each class.
Example:
Let's say we have a class with apparent limits 10-19. The real class limits would be 9.5 - 19.5. This means that any value from 9.5 (inclusive) up to, but not including, 20 would be included in this class. This addresses the ambiguity of values like 19.9 or 9.1. They would be properly categorized using the real class limits.
Class Boundaries vs. Class Limits
It's important to differentiate between class limits and class boundaries. While closely related, they serve distinct purposes.
- Class Limits: Define the actual range of values included within a class. They can be apparent or real.
- Class Boundaries: Represent the precise points where one class ends and the next begins. They are usually halfway between the upper limit of one class and the lower limit of the next. They effectively eliminate any gaps or overlaps between classes.
Example:
Using our previous example (10-19), the class boundaries would be determined by considering the next class. If the next class is 20-29, the upper class boundary of 10-19 would be 19.5, and the lower class boundary of 20-29 would also be 19.5. This ensures no data point falls into a gap or is counted twice.
Class Width (or Class Interval)
The class width is the difference between the upper and lower real class limits of a class. It represents the range of values contained within a single class. Consistent class widths are crucial for accurate data interpretation and analysis.
Importance of Class Limits in Statistical Analysis
Accurate class limits are essential for various statistical calculations and interpretations:
- Frequency Distribution Construction: Correctly defining class limits is the foundation of creating a meaningful grouped frequency distribution. Incorrect limits lead to misclassifications and inaccurate frequency counts.
- Descriptive Statistics: Class limits are necessary for calculating descriptive statistics like the mean, median, and mode, especially when dealing with grouped data. Approximation techniques are often used, and accurate class limits are vital for reducing error.
- Graphical Representation: Class limits are essential for accurately representing data graphically using histograms or frequency polygons. Incorrect limits will distort the visual representation of the data distribution.
- Inferential Statistics: Many inferential statistical tests rely on the accuracy of the data organization. Class limits directly influence the accuracy of these tests.
Common Mistakes and Misconceptions
Several common mistakes arise when working with class limits:
- Confusing Apparent and Real Class Limits: Failing to distinguish between apparent and real limits can lead to significant errors in calculations and interpretations.
- Ignoring Class Boundaries: Overlooking class boundaries can result in overlapping classes or gaps in the data representation, distorting the analysis.
- Inconsistent Class Widths: Using inconsistent class widths makes comparisons between classes difficult and can lead to misleading conclusions.
- Rounding Errors: Rounding errors when calculating class limits can accumulate, affecting the accuracy of subsequent calculations.
Practical Applications and Examples
Let's illustrate the concepts with a practical example. Suppose we have the following data representing the weights (in kilograms) of 20 students:
62, 65, 68, 70, 72, 75, 78, 80, 82, 85, 88, 90, 92, 95, 98, 100, 102, 105, 108, 110
We can group this data into classes. Let's choose a class width of 10.
| Apparent Class Limits | Real Class Limits | Frequency |
|---|---|---|
| 60-69 | 59.5 - 69.5 | 3 |
| 70-79 | 69.5 - 79.5 | 4 |
| 80-89 | 79.5 - 89.5 | 5 |
| 90-99 | 89.5 - 99.5 | 4 |
| 100-109 | 99.5 - 109.5 | 3 |
| 110-119 | 109.5 - 119.5 | 1 |
This table clearly shows the distinction between apparent and real class limits. Notice how the real limits eliminate any gaps and ensure each data point belongs to only one class.
Advanced Considerations
For more complex data sets, particularly those with a large range and/or significant variations in data distribution, more advanced considerations might be necessary for determining optimal class width and the number of classes. Techniques like Sturges' rule or the square root rule can help determine an appropriate number of classes, leading to more informative grouped frequency distributions. However, even with these techniques, the careful determination of class limits remains critical for accurate analysis.
Conclusion
Understanding class limits—both apparent and real—is fundamental to working effectively with grouped frequency distributions. Accurate determination and usage of class limits are crucial for constructing frequency distributions, calculating descriptive and inferential statistics, and representing data graphically. By avoiding common mistakes and carefully applying the principles outlined above, you can ensure the accuracy and reliability of your statistical analysis, leading to valuable insights from your data. Mastering class limits empowers you to effectively handle large datasets, make informed decisions, and communicate findings with clarity and precision.
Latest Posts
Latest Posts
-
How To Find All Zeros Of A Polynomial
Mar 26, 2025
-
How Do You Calculate The Heat Capacity Of A Calorimeter
Mar 26, 2025
-
Mendels Dihybrid Crosses Supported The Independent Hypothesis
Mar 26, 2025
-
Is Kinetic Energy Conserved In An Elastic Collision
Mar 26, 2025
-
Surplus And Shortage On A Graph
Mar 26, 2025
Related Post
Thank you for visiting our website which covers about What Are Class Limits In Statistics . We hope the information provided has been useful to you. Feel free to contact us if you have any questions or need further assistance. See you next time and don't miss to bookmark.
