How To Find Rate Constant From Graph
Muz Play
Mar 31, 2025 · 6 min read
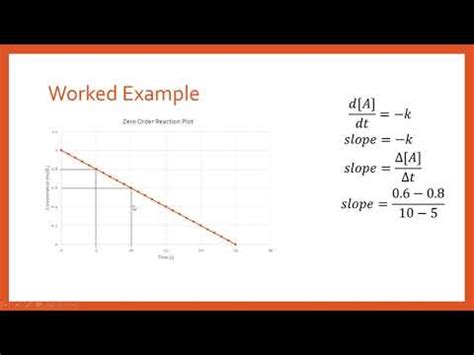
Table of Contents
How to Find the Rate Constant from a Graph
Determining the rate constant, often denoted as k, is a fundamental aspect of chemical kinetics. It quantifies the speed of a reaction, providing crucial insights into reaction mechanisms and predicting future behavior. While various methods exist, graphical analysis offers a powerful and intuitive approach to extract the rate constant directly from experimental data. This article delves into the intricacies of this technique, focusing on different reaction orders and their corresponding graphical representations. We'll explore how to identify the reaction order from the graph itself, a critical first step in accurately calculating k.
Understanding Reaction Orders and Rate Laws
Before diving into the graphical methods, let's refresh our understanding of reaction orders and rate laws. The rate law expresses the relationship between the reaction rate and the concentrations of reactants. A general rate law for a reaction aA + bB → products can be expressed as:
Rate = k[A]<sup>m</sup>[B]<sup>n</sup>
Where:
- k is the rate constant
- [A] and [B] are the concentrations of reactants A and B
- m and n are the reaction orders with respect to A and B, respectively. These are experimentally determined and are not necessarily related to the stoichiometric coefficients (a and b).
The overall reaction order is the sum of the individual orders (m + n). Common reaction orders include zero-order, first-order, second-order, and more complex scenarios. Understanding the reaction order is crucial because the graphical method for determining k varies depending on this order.
Graphical Methods for Determining the Rate Constant
The key to finding the rate constant graphically lies in manipulating the rate law to produce a linear equation whose slope or intercept directly reveals k. Let's explore the common scenarios:
1. Zero-Order Reactions
For a zero-order reaction, the rate is independent of reactant concentration. The rate law is:
Rate = k[A]<sup>0</sup> = k
This means the rate is constant throughout the reaction. Graphically, plotting [A] vs. time yields a straight line with a negative slope equal to -k.
Important Note: A zero-order reaction is generally observed when a reaction is saturated (e.g., an enzyme-catalyzed reaction at high substrate concentrations) or when the reaction rate is controlled by a factor other than reactant concentration (e.g., light intensity in a photochemical reaction).
How to find k from the graph: Simply measure the slope of the straight line obtained by plotting [A] versus time. Remember that the slope will be negative, so k will be the positive value of the slope (k = -slope).
2. First-Order Reactions
In a first-order reaction, the rate is directly proportional to the concentration of one reactant. The rate law is:
Rate = k[A]
Integrating this rate law gives the integrated rate law:
ln[A]<sub>t</sub> = -kt + ln[A]<sub>0</sub>
where:
- [A]<sub>t</sub> is the concentration of A at time t
- [A]<sub>0</sub> is the initial concentration of A
This equation has the form of a straight line (y = mx + c), where:
- y = ln[A]<sub>t</sub>
- x = t
- m = -k
- c = ln[A]<sub>0</sub>
Therefore, plotting ln[A] vs. time produces a straight line with a slope of -k.
How to find k from the graph: Measure the slope of the line obtained by plotting ln[A] versus time. The rate constant k is the negative of this slope (k = -slope).
3. Second-Order Reactions
Second-order reactions exhibit a rate dependence on the square of one reactant concentration or the product of two reactant concentrations. Let's focus on the simpler case where the rate is proportional to the square of one reactant's concentration:
Rate = k[A]<sup>2</sup>
Integrating this rate law yields:
1/[A]<sub>t</sub> = kt + 1/[A]<sub>0</sub>
This is also a straight line equation (y = mx + c), where:
- y = 1/[A]<sub>t</sub>
- x = t
- m = k
- c = 1/[A]<sub>0</sub>
Thus, plotting 1/[A] vs. time gives a straight line with a slope of k.
How to find k from the graph: Measure the slope of the straight line from plotting 1/[A] versus time. In this case, the slope is directly equal to the rate constant (k = slope).
Identifying the Reaction Order from the Graph
Before calculating k, it's crucial to determine the reaction order from the graph itself. This is done by plotting the appropriate function of concentration versus time and observing which plot yields a straight line:
- If [A] vs. time is linear: The reaction is zero-order.
- If ln[A] vs. time is linear: The reaction is first-order.
- If 1/[A] vs. time is linear: The reaction is second-order.
Beyond Simple Reaction Orders
While the above examples focus on simple reaction orders involving a single reactant, more complex situations involve multiple reactants and more intricate rate laws. For instance, a reaction might be first-order with respect to one reactant and second-order with respect to another. Analyzing such reactions requires a more nuanced approach, often involving integrated rate laws and techniques like the method of initial rates. However, the core principle remains the same: manipulate the rate law to create a linear relationship that allows for the determination of k from the slope or intercept of the resulting graph.
Practical Considerations and Error Analysis
When conducting graphical analysis, several practical considerations are essential:
-
Data Quality: Accurate and precise experimental data are paramount for reliable k determination. Errors in concentration measurements directly propagate into the calculated rate constant.
-
Linear Regression: Employing linear regression analysis provides a statistically robust method to fit a straight line to the data points and obtain the slope (and consequently, k). The regression analysis provides information on the goodness of fit (R<sup>2</sup> value) allowing assessment of the reliability of the derived rate constant. A high R<sup>2</sup> value (close to 1) indicates a good fit.
-
Units: Always pay close attention to the units of concentration and time. The units of k depend on the reaction order. For example, for a first-order reaction, k has units of s<sup>-1</sup> (inverse seconds) while for a second-order reaction k has units of M<sup>-1</sup>s<sup>-1</sup> (inverse molarity times inverse seconds).
Conclusion
Determining the rate constant from a graph provides a visually intuitive and powerful method for analyzing reaction kinetics. By understanding reaction orders and employing appropriate graphical representations, you can accurately determine k and gain valuable insights into the reaction mechanism. Remember the importance of data quality, linear regression analysis, and appropriate unit considerations for accurate and reliable results. While this method primarily focuses on simpler reaction orders, the underlying principle of manipulating the rate law to achieve a linear plot remains applicable even for more complex scenarios. Mastering these techniques is essential for any student or researcher working in the realm of chemical kinetics.
Latest Posts
Latest Posts
-
Where Is Oxide On The Periodic Table
Apr 02, 2025
-
How To Find The Critical Value Of R
Apr 02, 2025
-
Which Part Of Amino Acid Is Always Acidic
Apr 02, 2025
-
To Increase The Concentration Of A Solution You Could
Apr 02, 2025
-
Definition Of Social Location In Sociology
Apr 02, 2025
Related Post
Thank you for visiting our website which covers about How To Find Rate Constant From Graph . We hope the information provided has been useful to you. Feel free to contact us if you have any questions or need further assistance. See you next time and don't miss to bookmark.
