Income Effect And Substitution Effect Graph
Muz Play
Mar 24, 2025 · 7 min read
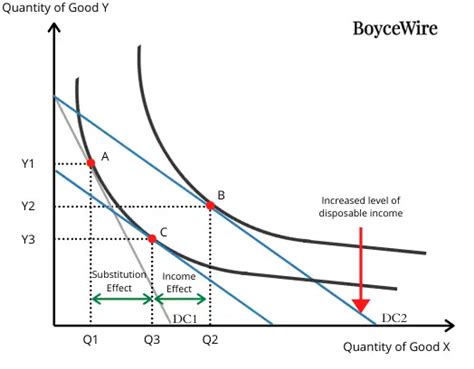
Table of Contents
Income Effect and Substitution Effect Graph: A Comprehensive Guide
Understanding consumer behavior is crucial for businesses and economists alike. A cornerstone of this understanding lies in the concepts of the income effect and the substitution effect, which explain how changes in price influence consumer choices. While these effects are often discussed theoretically, visualizing them through graphs provides a powerful tool for comprehension and analysis. This article dives deep into the income and substitution effects, providing a detailed explanation and graphical representation, with examples to solidify your understanding.
Understanding the Basics: Price Changes and Consumer Choices
Before we delve into the graphs, let's establish a foundational understanding of the income and substitution effects. When the price of a good changes, consumers react in two distinct ways:
-
Substitution Effect: This refers to the change in consumption of a good due solely to a change in its relative price, holding purchasing power constant. If the price of a good falls, it becomes relatively cheaper compared to other goods, leading consumers to substitute it for other, now relatively more expensive, goods. Conversely, a price increase makes the good relatively more expensive, prompting consumers to substitute it with cheaper alternatives.
-
Income Effect: This refers to the change in consumption resulting from a change in real income (purchasing power) caused by a price change. A price decrease effectively increases the consumer's purchasing power, allowing them to buy more of all goods, including the one whose price decreased. A price increase, on the other hand, reduces purchasing power, leading to a decrease in consumption of all goods.
Graphical Representation: The Consumer's Choice
The most effective way to visualize the income and substitution effects is through indifference curves and budget constraints.
Indifference Curves
Indifference curves represent all combinations of two goods that provide a consumer with the same level of satisfaction or utility. They possess several key characteristics:
- Downward sloping: To maintain the same level of utility, if the quantity of one good increases, the quantity of the other good must decrease.
- Convex to the origin: This reflects the diminishing marginal rate of substitution (MRS). The MRS represents the rate at which a consumer is willing to trade one good for another while maintaining the same level of satisfaction. It diminishes as the consumer consumes more of one good.
- Non-intersecting: Two indifference curves cannot intersect because it would imply that the same combination of goods provides two different levels of utility, which is logically inconsistent.
Budget Constraint
The budget constraint represents all combinations of two goods that a consumer can afford given their income and the prices of the goods. It is a straight line whose equation is:
M = P<sub>x</sub>X + P<sub>y</sub>Y
Where:
Mis the consumer's incomeP<sub>x</sub>is the price of good XXis the quantity of good XP<sub>y</sub>is the price of good YYis the quantity of good Y
Combining Indifference Curves and Budget Constraints
By plotting indifference curves and the budget constraint on a graph, with the quantity of good X on the horizontal axis and the quantity of good Y on the vertical axis, we can determine the optimal consumption bundle – the combination of goods that maximizes the consumer's utility given their budget. This optimal bundle is where the highest possible indifference curve is tangent to the budget constraint. The point of tangency represents the consumer's equilibrium.
Analyzing the Effects Graphically: A Price Decrease
Let's consider a scenario where the price of good X decreases. This will shift the budget constraint outwards, pivoting around the Y-intercept (since the price of Y and income remain unchanged).
1. Substitution Effect: To isolate the substitution effect, we draw a hypothetical budget line parallel to the new budget constraint but tangent to the original indifference curve. The movement along the original indifference curve from the initial equilibrium point to the point of tangency with the hypothetical budget line represents the substitution effect. This shows the change in consumption of good X due solely to its change in relative price. Because X is now relatively cheaper, consumption of X increases.
2. Income Effect: The movement from the point of tangency with the hypothetical budget line to the new equilibrium point (where the new budget constraint is tangent to a higher indifference curve) represents the income effect. The price decrease increases the consumer's purchasing power, enabling them to consume more of both goods. This leads to a further increase in the consumption of good X.
Therefore, the total effect of the price decrease is the sum of the substitution effect and the income effect, both contributing to an increase in the consumption of good X.
Analyzing the Effects Graphically: A Price Increase
A price increase of good X will have the opposite effect. The budget constraint will pivot inwards, rotating around the Y-intercept.
1. Substitution Effect: A hypothetical budget line parallel to the new budget constraint, but tangent to the original indifference curve, is drawn. The movement along the original indifference curve represents the substitution effect. Because X is now relatively more expensive, its consumption decreases.
2. Income Effect: The movement from the point of tangency with the hypothetical budget line to the new equilibrium point (where the new budget constraint is tangent to a lower indifference curve) represents the income effect. The price increase reduces purchasing power, leading to a decrease in the consumption of both goods, further decreasing the consumption of X.
In this case, both the substitution effect and the income effect contribute to a decrease in the consumption of good X.
Special Cases: Giffen and Inferior Goods
While the above examples demonstrate the typical case, there are exceptions:
-
Giffen Goods: A Giffen good is a special type of inferior good where the positive income effect outweighs the negative substitution effect. This means that when the price of a Giffen good decreases, the consumer's purchasing power increases, but they actually buy less of the good. This counterintuitive behavior is typically observed only for very basic, low-quality necessities. The graphical representation would show a backward-bending demand curve.
-
Inferior Goods: An inferior good is one whose demand decreases as income increases. For inferior goods, the income effect works against the substitution effect. While the substitution effect always leads to an increase in consumption when the price falls, the income effect works to decrease consumption. Whether the overall effect is an increase or decrease in consumption depends on the relative magnitudes of the two effects.
Applications and Implications
The understanding of income and substitution effects has far-reaching implications in various fields:
- Microeconomics: It helps explain consumer choices and the shape of demand curves.
- Public Policy: Governments use this knowledge to design effective policies related to taxation, subsidies, and welfare programs. Understanding how consumers react to price changes is essential for evaluating the impact of these policies.
- Marketing: Businesses can utilize this knowledge to forecast demand, optimize pricing strategies, and develop effective marketing campaigns. Knowing how the price of a good affects its consumption is fundamental for maximizing profitability.
- Labor Economics: The concepts can be applied to the labor market to analyze the effect of wage changes on labor supply.
Conclusion
The income and substitution effects are fundamental concepts in economics that explain how price changes influence consumer behavior. By utilizing indifference curves and budget constraints, we can graphically analyze these effects, providing a clearer understanding of their individual contributions and overall impact on consumption. While the typical case shows the two effects working in the same direction, exceptions exist with Giffen and inferior goods, underscoring the complexity and nuance of consumer choices. This comprehensive understanding is invaluable for economists, policymakers, businesses, and anyone interested in understanding the intricacies of market dynamics and consumer behavior. The graphical representation presented here serves as a robust and intuitive tool for mastering these essential economic principles.
Latest Posts
Latest Posts
-
How Do You Calculate The Heat Capacity Of A Calorimeter
Mar 26, 2025
-
Mendels Dihybrid Crosses Supported The Independent Hypothesis
Mar 26, 2025
-
Is Kinetic Energy Conserved In An Elastic Collision
Mar 26, 2025
-
Surplus And Shortage On A Graph
Mar 26, 2025
-
Indicate Whether Or Not The Following Molecules Are Chiral
Mar 26, 2025
Related Post
Thank you for visiting our website which covers about Income Effect And Substitution Effect Graph . We hope the information provided has been useful to you. Feel free to contact us if you have any questions or need further assistance. See you next time and don't miss to bookmark.
