Energy Diagram For A Two Step Reaction
Muz Play
Mar 19, 2025 · 6 min read
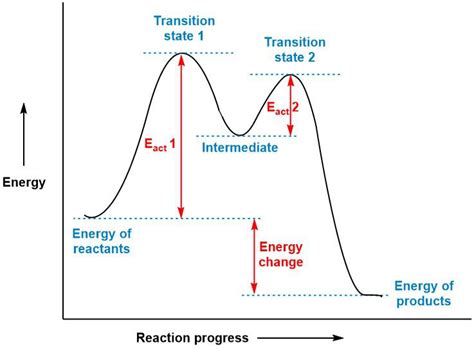
Table of Contents
Energy Diagrams for Two-Step Reactions: A Comprehensive Guide
Understanding reaction mechanisms is crucial in chemistry. Visualizing these mechanisms is often done using energy diagrams, which provide a clear picture of the energy changes occurring during a reaction. This article delves into the intricacies of energy diagrams, focusing specifically on two-step reactions. We'll explore the key features, interpretations, and how to construct and utilize these diagrams effectively.
What is an Energy Diagram?
An energy diagram, also known as a reaction coordinate diagram or reaction profile, is a graphical representation of the energy changes that take place during a chemical reaction. The x-axis represents the reaction coordinate, which is a general measure of the progress of the reaction from reactants to products. It doesn't correspond to a specific measurable quantity but rather symbolizes the overall transformation. The y-axis represents the potential energy of the system.
The diagram illustrates the energy of the reactants, products, and any intermediate species formed during the reaction. Crucially, it also highlights the activation energies (Ea) – the energy barriers that must be overcome for the reaction to proceed.
Two-Step Reactions: A Deeper Dive
Two-step reactions involve two distinct elementary steps, each with its own activation energy. These steps often proceed through the formation of an intermediate, a high-energy species that exists briefly before reacting further to form the final products. The overall reaction involves a sequence of events:
- First elementary step: Reactants transform into an intermediate.
- Second elementary step: The intermediate transforms into the products.
Deconstructing the Energy Diagram for a Two-Step Reaction
The energy diagram for a two-step reaction displays two distinct peaks, corresponding to the transition states of each elementary step. Let's break down the key components:
-
Reactants (R): The starting materials of the reaction, located at the leftmost point of the diagram. Their energy level is the initial potential energy.
-
Intermediate (I): A high-energy species formed during the reaction. It represents a point on the reaction coordinate where the system is neither fully reactants nor fully products. Note that the energy of the intermediate is generally higher than both reactants and products in a two-step reaction.
-
Products (P): The final species formed after the reaction is complete. Their energy level indicates the final potential energy of the system.
-
Transition States (TS1 and TS2): These represent the highest-energy points along the reaction pathway for each elementary step. They are unstable species representing the activated complex in each step – a fleeting configuration with the highest potential energy during the transition from one species to the next. Transition states are not intermediates. They exist only momentarily before converting into the next species.
-
Activation Energies (Ea1 and Ea2): These represent the energy differences between the reactants/intermediate and their respective transition states. Ea1 is the activation energy for the first step, and Ea2 is the activation energy for the second step. The higher the activation energy, the slower the reaction rate for that step.
-
ΔH (Enthalpy Change): This represents the overall energy difference between the reactants and products. A negative ΔH indicates an exothermic reaction (releases heat), while a positive ΔH indicates an endothermic reaction (absorbs heat). In a two-step reaction, ΔH is the overall energy difference between the initial reactants and the final products. It's important to note that the enthalpy change is independent of the reaction mechanism. Multiple mechanisms with differing intermediates can result in the same overall enthalpy change.
-
Reaction Coordinate: The x-axis, showing the progress of the reaction.
Constructing an Energy Diagram
To construct an accurate energy diagram for a two-step reaction, you'll need to know:
-
The relative energies of reactants, intermediate, and products: This information is often obtained experimentally or through computational methods.
-
The activation energies for each step: These values also come from experimental kinetic studies or computational analysis.
Once you have this data, plot the points corresponding to these energy levels on the y-axis and position them along the reaction coordinate on the x-axis to reflect the reaction pathway. Remember that the reaction coordinate is not a linear scale; instead, it represents the progression through the reaction mechanism. Connecting these points with smooth curves creates the characteristic energy diagram.
Interpreting Energy Diagrams
Energy diagrams are invaluable tools for understanding reaction mechanisms. From the diagram, we can infer:
-
The rate-determining step: This is the slowest step in the reaction, which determines the overall reaction rate. In a two-step reaction, this corresponds to the step with the higher activation energy (larger Ea).
-
The overall reaction's thermodynamics: The sign of ΔH (positive or negative) indicates whether the reaction is endothermic or exothermic, respectively. The magnitude of ΔH gives the amount of heat absorbed or released.
-
The stability of intermediates: The energy level of the intermediate reflects its relative stability. A lower energy intermediate is more stable.
-
The feasibility of the reaction: If the activation energy is too high, the reaction may be impractically slow. The relative heights of the transition state barriers determine the overall reaction rate, especially if the reaction is multi-step.
Example: A Specific Two-Step Reaction
Let's consider a hypothetical two-step reaction:
Step 1: A + B → I (slow step) Step 2: I → C + D (fast step)
Overall: A + B → C + D
In this scenario, let's assume:
- Reactants (A + B) have a potential energy of 0 kJ/mol.
- The intermediate (I) has a potential energy of 50 kJ/mol.
- The products (C + D) have a potential energy of -20 kJ/mol.
- Ea1 (for step 1) is 80 kJ/mol.
- Ea2 (for step 2) is 30 kJ/mol.
The energy diagram would show a higher peak for the first step (TS1) at 80 kJ/mol, representing the rate-determining step because of its higher activation energy. The second peak (TS2) would be lower at 50 + 30 = 80 kJ/mol relative to the intermediate. The overall enthalpy change (ΔH) would be -20 kJ/mol, indicating an exothermic reaction. This illustrates how the energy diagram reflects both the kinetics (rates) and thermodynamics (energy changes) of the reaction.
Advanced Considerations: Catalysis
Catalysts accelerate reaction rates by lowering the activation energy. In a two-step reaction, a catalyst might lower either Ea1, Ea2, or both. On the energy diagram, this would be depicted as a lowering of the peaks corresponding to the transition states. The enthalpy change (ΔH) remains unaffected by a catalyst, as it only affects the reaction pathway, not the overall energy difference between reactants and products.
Conclusion: The Power of Visualization
Energy diagrams are crucial for understanding the mechanisms of two-step reactions. They provide a visual representation of the energy changes, highlighting key features like activation energies, the rate-determining step, and the overall reaction thermodynamics. Mastering the interpretation and construction of these diagrams is essential for anyone seeking a deep understanding of chemical reaction kinetics and mechanisms. By analyzing these diagrams, chemists can design experiments, predict reaction outcomes, and develop strategies for optimizing reaction efficiency, including the exploration of suitable catalysts to lower activation energy barriers. The ability to visualize complex reactions simplifies the understanding of a process and paves the way for further research and improvement of reaction designs. This visual approach aids in deeper comprehension of intricate chemical phenomena and contributes significantly to the advancement of chemical science.
Latest Posts
Latest Posts
-
What Number Uniquely Identifies An Element
Mar 20, 2025
-
An Atom That Has Gained Or Lost Electrons
Mar 20, 2025
-
Compounds Containing Only Carbon And Hydrogen Are Called
Mar 20, 2025
-
How Many Covalent Bonds Does Hydrogen Have
Mar 20, 2025
-
Oxidation Of An Aldehyde Produces A
Mar 20, 2025
Related Post
Thank you for visiting our website which covers about Energy Diagram For A Two Step Reaction . We hope the information provided has been useful to you. Feel free to contact us if you have any questions or need further assistance. See you next time and don't miss to bookmark.
