Pie Chart Of The Cell Cycle
Muz Play
Mar 23, 2025 · 6 min read
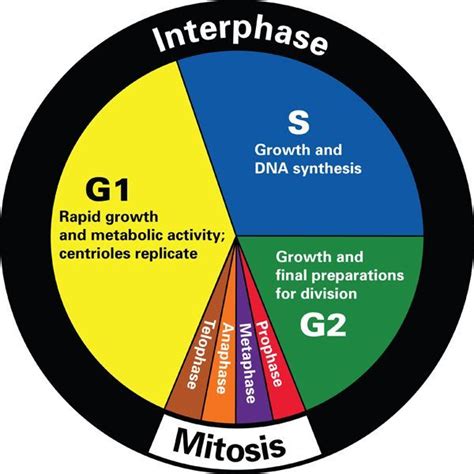
Table of Contents
Decoding the Cell Cycle: A Comprehensive Guide to the Pie Chart Representation
The cell cycle, the intricate series of events leading to cell growth and division, is a fundamental process in all living organisms. Understanding its phases is crucial in various fields, from developmental biology to cancer research. A visually compelling way to grasp the relative durations of each phase is through a pie chart representation of the cell cycle. This article delves deep into the intricacies of the cell cycle, explaining each phase in detail and clarifying how it's effectively represented in a pie chart. We will explore the significance of the proportions depicted in the pie chart, the variations across different cell types, and the implications for understanding cellular processes and diseases.
The Phases of the Cell Cycle: A Detailed Breakdown
The cell cycle is conventionally divided into two major phases: Interphase and the Mitotic (M) phase. Interphase, the longest phase, is further subdivided into three distinct stages: G1, S, and G2. The M phase encompasses mitosis and cytokinesis.
1. Interphase: The Preparation Phase
Interphase is not a period of inactivity, but rather a time of intense metabolic activity where the cell prepares for division.
-
G1 (Gap 1) Phase: This is the initial growth phase following cell division. The cell increases in size, synthesizes proteins and organelles, and carries out its normal metabolic functions. The duration of G1 varies greatly depending on the cell type and external factors. This phase is a critical checkpoint where the cell assesses its readiness for DNA replication. If conditions are unfavorable, the cell may enter a non-dividing state called G0.
-
S (Synthesis) Phase: This is the phase where DNA replication occurs. Each chromosome is duplicated, creating two identical sister chromatids joined at the centromere. This precise duplication is vital to ensure each daughter cell receives a complete and accurate copy of the genome. The accurate replication of DNA is meticulously controlled by a complex network of enzymes and proteins.
-
G2 (Gap 2) Phase: This is the second growth phase. The cell continues to grow and synthesize proteins necessary for mitosis. The cell also checks for any DNA replication errors and prepares for the upcoming division. This phase is another important checkpoint ensuring the cell is ready for mitosis. Any damage to the DNA during replication will trigger repair mechanisms or halt the cell cycle.
2. M (Mitotic) Phase: Cell Division
The M phase is characterized by the visible separation of duplicated chromosomes and the division of the cytoplasm. It comprises two key processes:
-
Mitosis: This process involves the precise segregation of duplicated chromosomes into two identical sets. It's further divided into several distinct stages: prophase, prometaphase, metaphase, anaphase, and telophase. Each stage is characterized by specific chromosomal movements and changes in the cellular structure. Accurate chromosome segregation is essential to avoid genetic abnormalities in the daughter cells.
-
Cytokinesis: Following mitosis, cytokinesis physically divides the cytoplasm, resulting in two separate daughter cells. In animal cells, a cleavage furrow forms, constricting the cell membrane until it divides. In plant cells, a cell plate forms, creating a new cell wall between the daughter cells.
The Pie Chart Representation of the Cell Cycle
A pie chart provides a clear and concise visualization of the relative durations of each phase of the cell cycle. The size of each slice corresponds to the percentage of the total cell cycle time spent in that phase. The exact proportions vary considerably depending on factors such as:
-
Cell Type: Rapidly dividing cells, like those in the bone marrow or gut lining, will have shorter G1 and G2 phases relative to the S and M phases. Conversely, cells that divide infrequently, or not at all (like neurons), spend a much longer time in G0 or G1.
-
External Factors: Nutritional status, growth factors, and environmental stressors can significantly influence the duration of each phase. For instance, nutrient deprivation can cause cell cycle arrest in G1.
-
Cellular Health: DNA damage or other cellular stresses can cause delays or arrests in various phases of the cell cycle, allowing time for repair mechanisms or apoptosis (programmed cell death).
A Typical Pie Chart Representation (Illustrative):
While the exact proportions will vary, a typical pie chart might show:
- G1 Phase: Approximately 40-50%
- S Phase: Approximately 30-40%
- G2 Phase: Approximately 10-15%
- M Phase: Approximately 5-10%
Important Note: This is a generalized representation. The actual percentages will vary significantly based on the factors mentioned above. The pie chart should always be accompanied by a detailed description specifying the cell type and conditions under which the data was obtained.
Significance and Applications of the Cell Cycle Pie Chart
Understanding the cell cycle and its representation through a pie chart is essential in several areas:
-
Cancer Research: Cancer cells exhibit uncontrolled cell growth and division. Analyzing the cell cycle phases in cancer cells reveals disruptions in the normal regulation mechanisms. Disproportionate time spent in specific phases can indicate potential therapeutic targets. For instance, targeting the S phase with specific drugs can inhibit uncontrolled DNA replication in cancer cells.
-
Developmental Biology: The precise regulation of the cell cycle is crucial during embryonic development. Understanding the timing and duration of cell cycle phases during various developmental stages provides insights into the mechanisms of morphogenesis and tissue formation.
-
Drug Development: Many anticancer drugs target specific phases of the cell cycle, inhibiting cell division and reducing tumor growth. Knowing the proportions of each phase in a specific cancer type allows for the development of more targeted therapies.
Beyond the Simple Pie Chart: A Deeper Dive
While the basic pie chart offers a valuable overview, a more nuanced understanding requires considering:
-
Cell Cycle Checkpoints: The pie chart doesn't explicitly represent the cell cycle checkpoints (G1/S, G2/M, and spindle checkpoints). These checkpoints ensure that each phase is completed correctly before proceeding to the next. Detailed analysis may incorporate these checkpoints as separate components or annotations to the pie chart.
-
Cell Cycle Control Mechanisms: The pie chart doesn't illustrate the complex regulatory networks controlling the cell cycle progression. Factors like cyclins, cyclin-dependent kinases (CDKs), and tumor suppressor genes are essential in orchestrating the transitions between phases.
-
Variations within a Population: A single pie chart represents an average across a cell population. Individual cells within the population may exhibit variability in the duration of each phase due to stochastic events or cellular heterogeneity. Advanced techniques may be needed to analyze this variability at the single-cell level.
-
Apoptosis: The pie chart doesn't directly account for programmed cell death (apoptosis). Cells that undergo apoptosis exit the cell cycle prematurely. A complete representation might require the inclusion of a separate segment representing the fraction of cells undergoing apoptosis.
Conclusion: The Power of Visualization in Cell Biology
The pie chart representation of the cell cycle, while seemingly simple, provides a powerful visual tool for understanding the relative durations of different phases. It serves as a foundation for more in-depth analyses of cell cycle regulation and its disruptions in diseases like cancer. By combining the visual simplicity of a pie chart with a detailed understanding of the underlying mechanisms, we gain valuable insights into this fundamental biological process and its implications across various fields of biological research. Remember to always critically evaluate the data presented in the chart, considering the specific cell type, conditions, and limitations of the methodology. The cell cycle is a dynamic and complex process, and a comprehensive understanding requires a multi-faceted approach combining visual representation with detailed mechanistic analysis.
Latest Posts
Latest Posts
-
Chi Square Test For Association Calculator
Mar 25, 2025
-
An Ion Has Unequal Numbers Of
Mar 25, 2025
-
Calculate Average Atomic Mass Of Isotopes
Mar 25, 2025
-
Understanding Theoretical Actual And Percent Yield
Mar 25, 2025
-
Are The Most Organized State Of Matter Responses
Mar 25, 2025
Related Post
Thank you for visiting our website which covers about Pie Chart Of The Cell Cycle . We hope the information provided has been useful to you. Feel free to contact us if you have any questions or need further assistance. See you next time and don't miss to bookmark.
